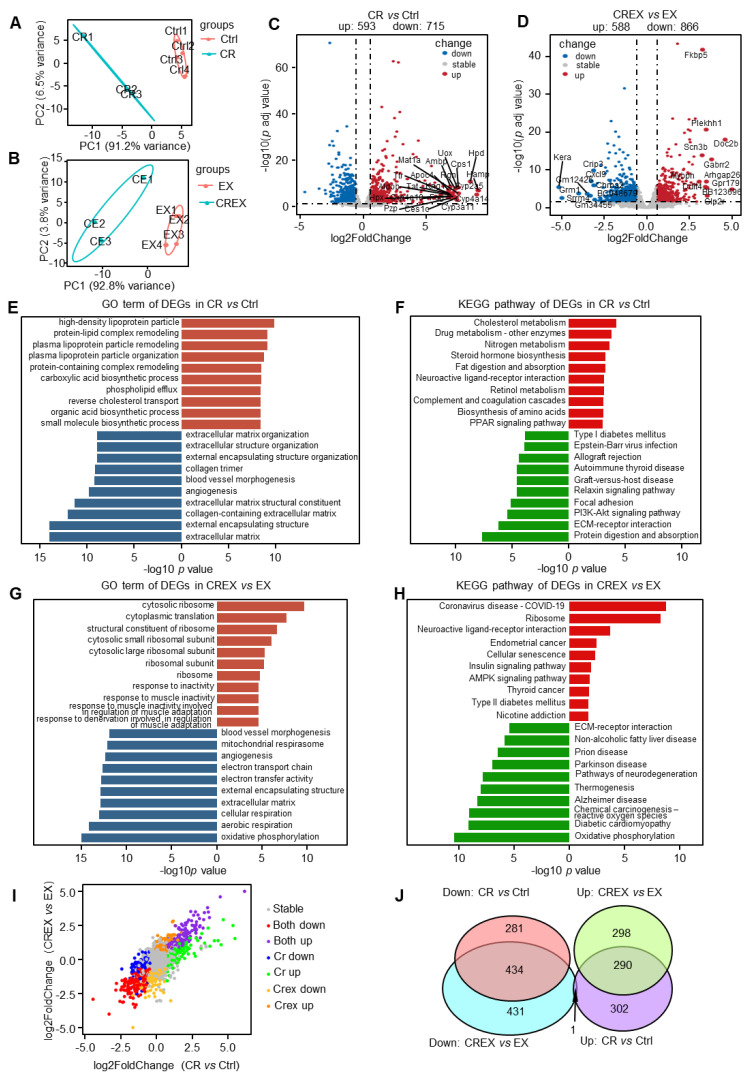
Figure 4.
Transcriptomic changes in skeletal muscle upon CR with or without EX. (A,B) principal component analysis plot of the skeletal muscle samples in the control and CR groups (A) and in the EX and CREX groups (B). (C,D) Volcano plots of DEGs in the CR vs. control groups (C) and in the CREX vs. EX groups (D). The top 20 genes with the largest absolute values for log2FC were labeled (down: p < 0.05 and log2FC < −0.58; up: p < 0.05 and log2FC > 0.58). (E) Enriched GO terms for all DEGs in the skeletal muscle upon CR. (F) Enriched KEGG pathways for all DEGs in the skeletal muscle upon CR. (G) Enriched GO terms for all DEGs in the skeletal muscle upon CREX. (H) Enriched KEGG pathways for all DEGs in the skeletal muscle upon CREX. (I) Dot plot of genes’ log2FC in CR vs. control groups and CREX vs. EX groups. Dots with different colors represent genes in different patterns. Stable, genes that were not differently expressed in the CR vs. control groups or CREX vs. EX groups; Both down, downregulated DEGS across the two comparisons; Both up, upregulated DEGS across the two comparisons; CR down, specific downregulated DEGS in the comparison between the CR and control groups; CR up, upregulated DEGS in the comparison between the CR and control groups; CREX down, specific downregulated DEGS in the comparison between the CREX and EX groups; CREX up, upregulated DEGS in the comparison between the CREX and EX groups. (J) Venn plot of common and distinct DEGs upon CR with or without EX. Brick red, enriched GO terms for upregulated DEGs; navy blue, enriched GO terms for downregulated DEGs; bright red, enriched KEGG pathways for upregulated DEGs; green, enriched KEGG pathways for downregulated DEGs.

