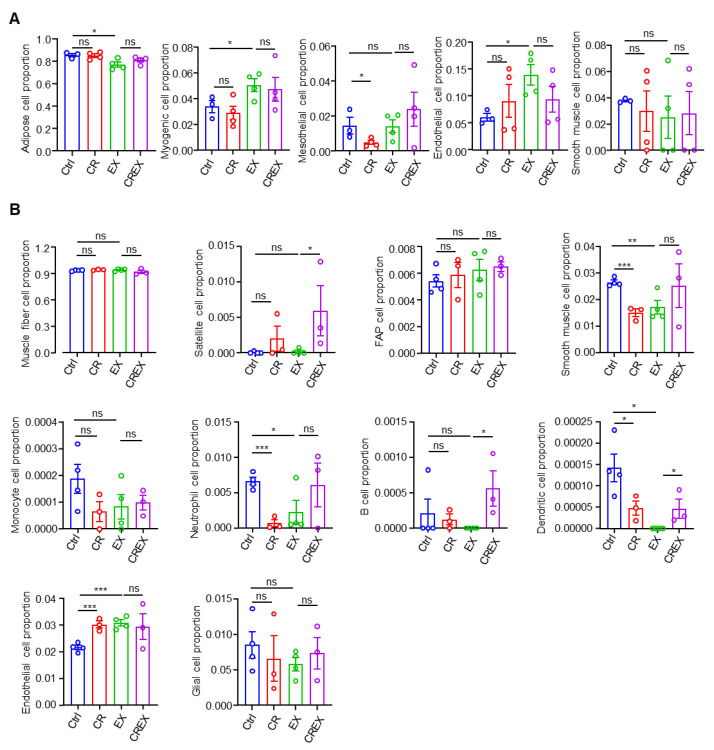
Figure 6.
Cell proportion alterations as a result of CR with or without EX across the two tissues. (A) Boxplots of estimated cell type proportions in BAT bulk RNA sequencing from four intervention groups. Cell populations with numbers equal to or close to zero are not shown. (B) Boxplots of estimated cell type proportions in skeletal muscle bulk RNA sequencing from four intervention groups. Cell populations with numbers equal to or close to zero are not shown. Statistical significance was measured using unpaired one-tailed t tests or Wilcoxon rank sum and signed rank tests. Data are represented as means ± SEM. * p < 0.05, ** p < 0.01, *** p < 0.001; ns, not significant. FAP, fibro-adipogenic progenitor.

