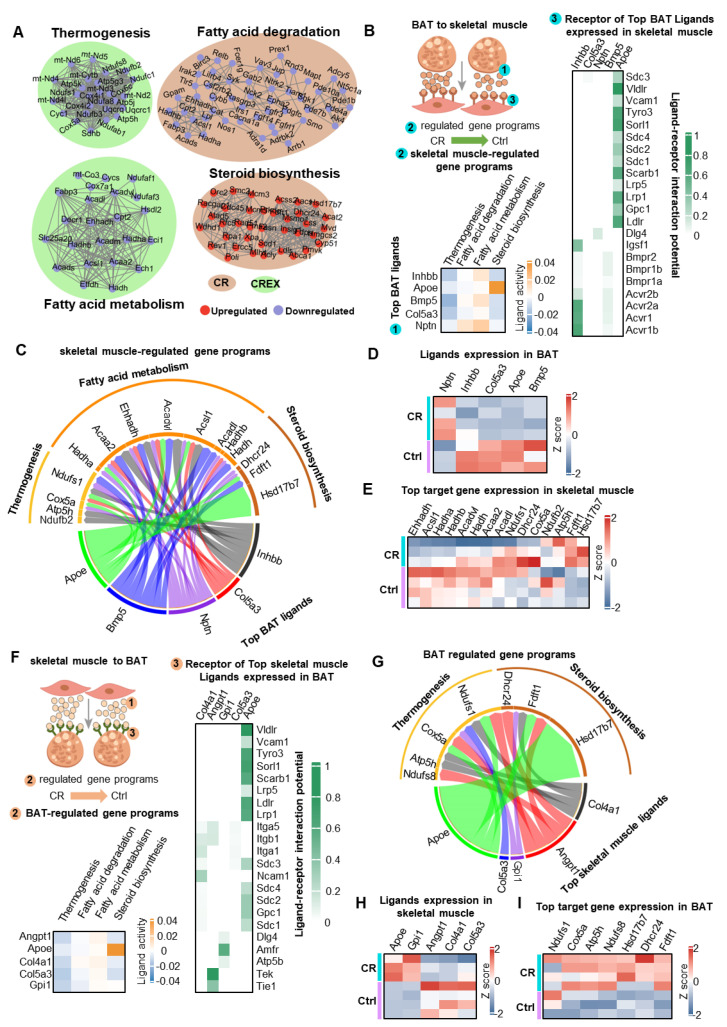
Figure 7.
The crosstalk between BAT and muscle. (A) Gene networks for selected DEGs from the two tissues that encoded interacting proteins clustered by MCODE, with each cluster named according to the most significantly enriched pathway. The clusters are colored according to the DEG direction and tissue category. (B) NicheNet workflow (left top), the activity of the top five putative BAT ligands (left bottom) and the interaction potential for the putative receptors of the top five BAT ligands in skeletal muscle (right). (C) Predicted interactions between BAT ligands and their predicted skeletal muscle target genes associated with the indicated KEGG pathways. (D,E) Expressions of the genes encoding the top five predicted upstream ligands in BAT (D) and of their top target genes in skeletal muscle related to the indicated KEGG pathways (E). (F) NicheNet workflow (bottom), the activity of the top five putative skeletal muscle ligands (bottom) and the interaction potential for the putative BAT receptors (right). (G) Predicted interactions between skeletal muscle-derived ligands and their predicted BAT target genes belonging to the indicated KEGG pathways. (H,I) Expressions of the genes encoding the top five predicted ligands in skeletal muscle (H) and of their top target genes in BAT associated with the indicated KEGG pathways (I).

