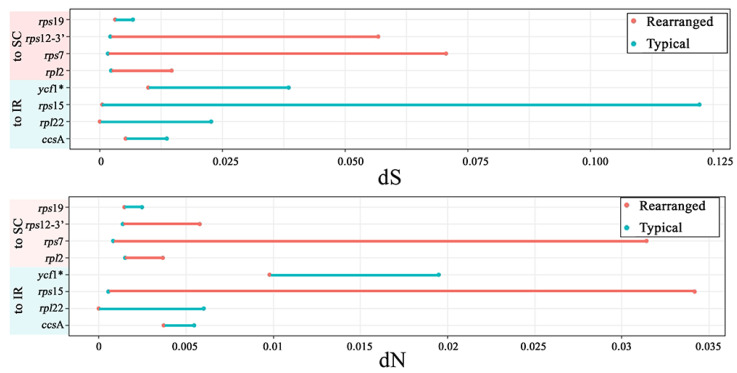
Figure 4.
Comparison of synonymous (dS) and nonsynonymous (dN) substitution rates between species with rearranged and conserved plastomes in eight regions. A region with a significant p-value (p-value < 0.05) was tagged by an asterisk (*) in its gene name. The red color in the bar graph indicates an acceleration of the substitution rates; the blue color indicates a deceleration of the substitution rates.

