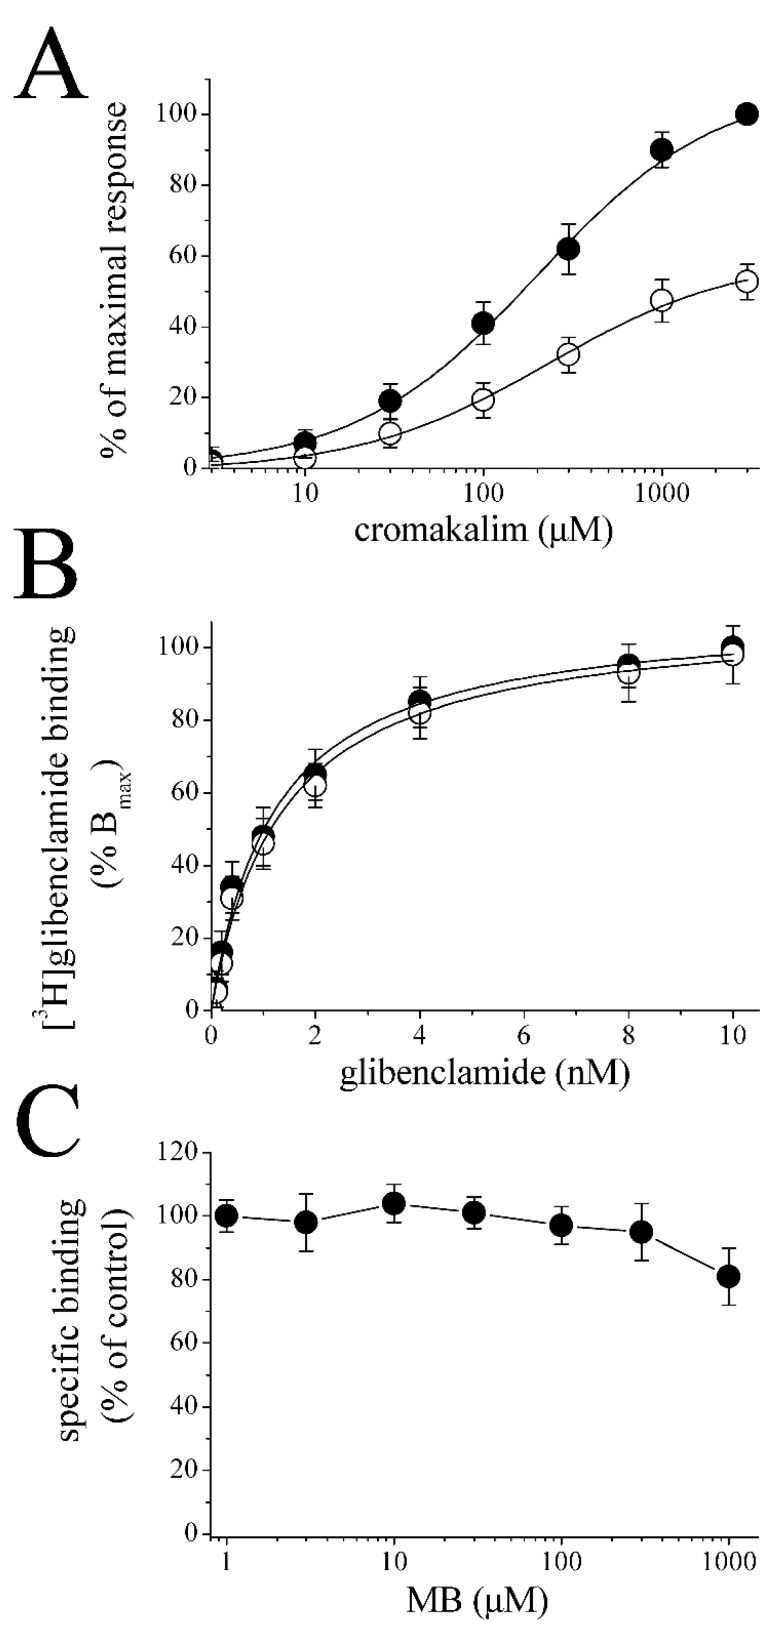
Figure 3.
The effects of MB on the cromakalim dose-response curve and the specific binding of [3H]glibenclamide. (A) Concentration-response curves for cromakalim-activated currents in the absence (filled circles) and presence (open circles) of MB (30 μM). MB was administered for 20 min, and cromakalim and MB were then co-administered for 2 min. Data points represent the mean ± S.E.M. (n = 5–6; error bars not visible are smaller than the size of the symbols). Curves show the best fit of the data to the logistic equation presented in the methods section. The concentration-response curves are normalized to maximal control cromakalim response. (B) Specific binding as a function of the concentration of [3H]glibenclamide in the absence (filled circles) and presence of 30 μM MB (open circles). Data represent the means of four experimental measurements. The incubation time was 60 min at 22 °C, pH 7.5. In order to determine nonspecific binding, samples were incubated with 10 nM of unlabeled glibenclamide. (C) Increasing concentrations of MB do not alter the specific binding of [3H]glibenclamide (1 nM). Data represent the results of 4–5 experiments. Data points show means ± S.E.M. Microsomal membranes were incubated with 1 nM [3H]glibenclamide (0.3–0.5 mg/mL for 60 min) with increasing concentrations of MB in the medium. Free and bound [3H]glibenclamide were separated by filtration. MB: methylene blue.

