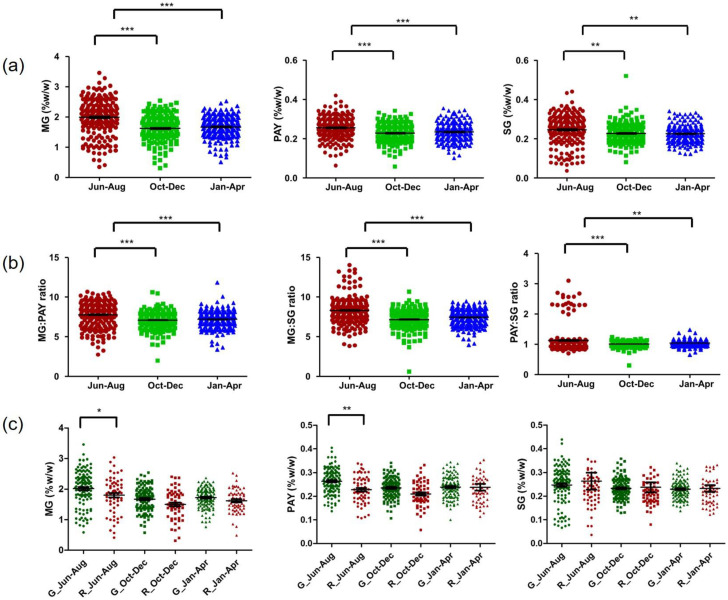
Figure 8.
Distribution of alkaloids in kratom leaves across Thailand. (a) Comparison of MG, PAY, and SG contents in each collection; (b) plots of MG:PAY, MG:SG, and PAY:SG ratios; (c) multiple comparisons of MG, PAY, and SG contents in red- and green-veined kratom plants. The data were analyzed using one-way ANOVA, followed by Bonferroni’s multiple comparison test. *, **, *** demonstrate significant differences at p-value < 0.05, 0.01, and 0.001, respectively.

