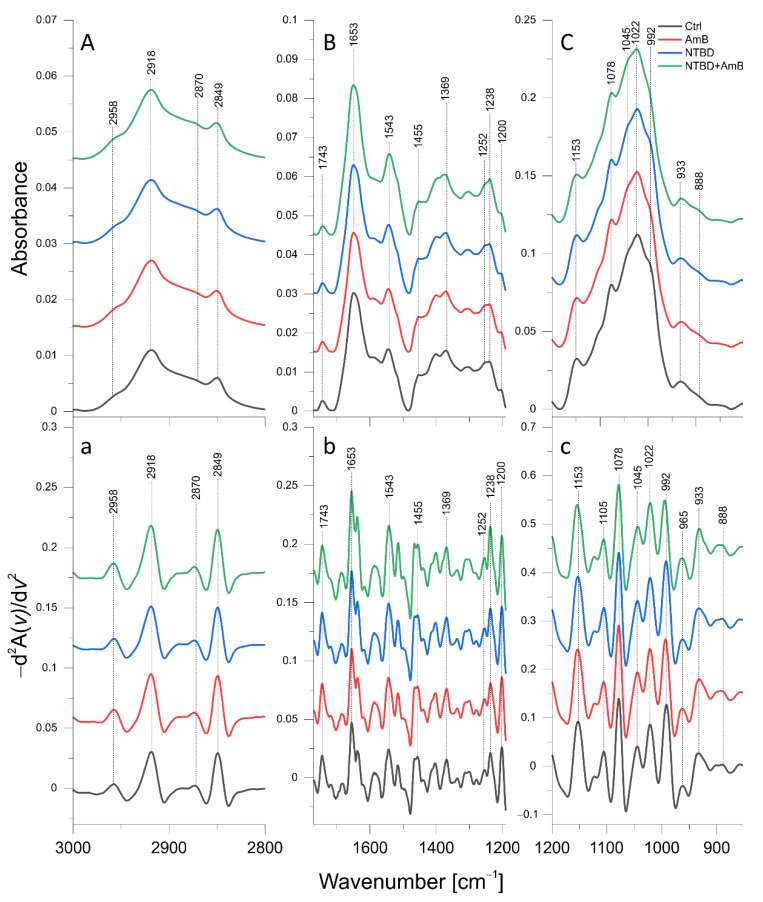
Figure 6.
Mean ATR-FTIR spectra of control C. albicans cells and cells treated with AmB (0.06 µg/mL), NTBD (4 µg/mL), and their combination: (A)—3000–2800 cm−1 region of ATR-FTIR spectra; (B)—1750–1190 cm−1 region of ATR-FTIR spectra; (C)—1200–800 cm−1 region of ATR- FTIR spectra; a–c—reversed second derivatives of spectra presented in (A–C).

