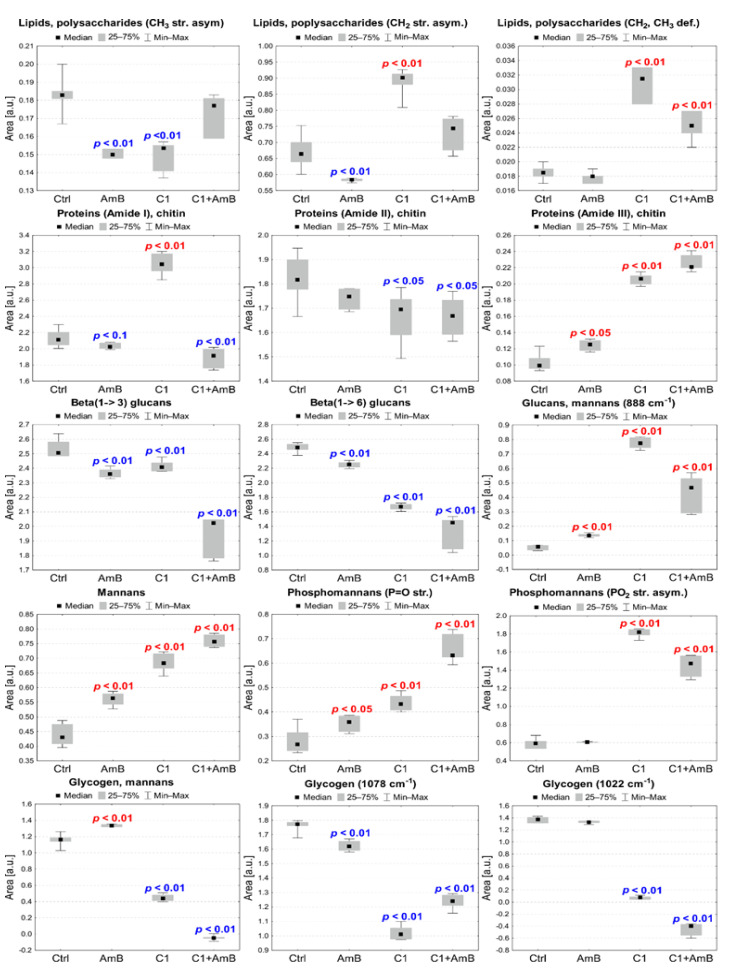
Figure 7.
The median, minimal, and maximal values of intensities of selected absorption bands presenting differences between C. albicans exposed to AmB, C1, and C1 + AmB treatment and control (Ctrl) group. The p-values of Mann–Whitney U test for statistically significant changes compared with the control are placed on the charts (red—ncreases, blue—decreases).

