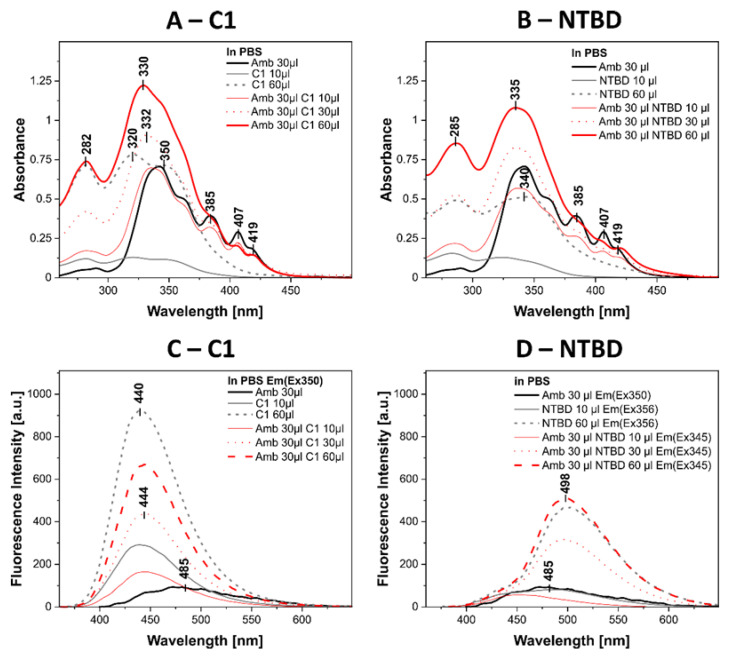
Figure 9.
(A)—electron absorption spectra for C1, AmB, and the C1+AmB synergistic system in PBS buffer at varying concentrations of the compound. The molar concentration of AmB was 0.0107 mM, and the molar concentration of C1 was 0.0159 mM for the 10 μL dose and 0.0942 mM for 60 μL. The successive molar concentrations of C1 in the synergistic system were 0.0158 mM, 0.0471 mM, and 0.0933 mM; (B)—electron absorption spectra for NTBD, AmB, and the NTBD+AmB synergistic system in PBS buffer at varying concentrations of the compound. The molar concentration of AmB was 0.0107 mM, and the molar concentration of NTBD was 0.0099 mM for the 10 μL dose and 0.0587 mM for 60 μL. The successive molar concentrations of compound NTBD were 0.0098 mM, 0.0294 mM, and 0.0581 mM; (C)—electron emission spectra corresponding to the absorption spectra in A; (D)—electron emission spectra corresponding to the absorption spectra in B.

