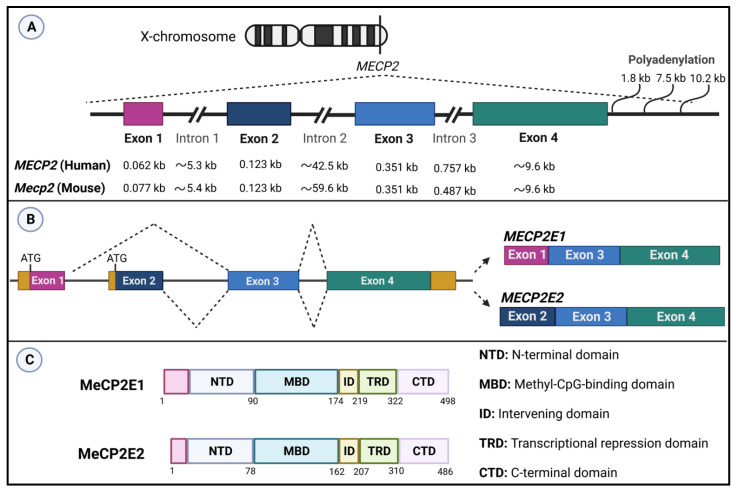
Figure 1.
Schematic diagram of (A) MECP2/Mecp2 gene, (B) MECP2E1 and MECP2E2 transcripts, (C) MeCP2E1 and MeCP2E2 isoforms. MeCP2: methyl-CpG binding protein 2. The dark yellow boxes show 5′ and 3′ untranslated regions (UTR). The drawing is not to scale. Information obtained from [12,74,75,77]. Figure is created with BioRender.com.

