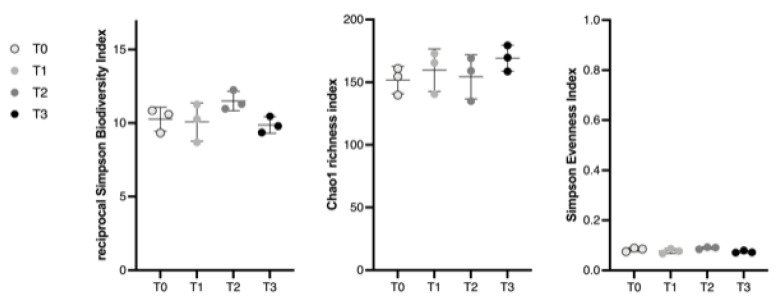
Figure 2.
Scatterplots depicting α diversity indices at each step of the fecal manipulation procedure (T0–3). Each dot represents a subsample (A, B, C). Bacterial intrinsic diversity was deduced from the reciprocal Simpson biodiversity index, bacterial genus richness from the Chao1 index and bacterial genus evenness from Simpson’s index. No significant difference was found between groups regarding the reciprocal Simpson index, population richness and Simpson-derived evenness based on a Friedman test. Horizontal lines represent the mean and error bars indicate the 95% CIs for each time point.

