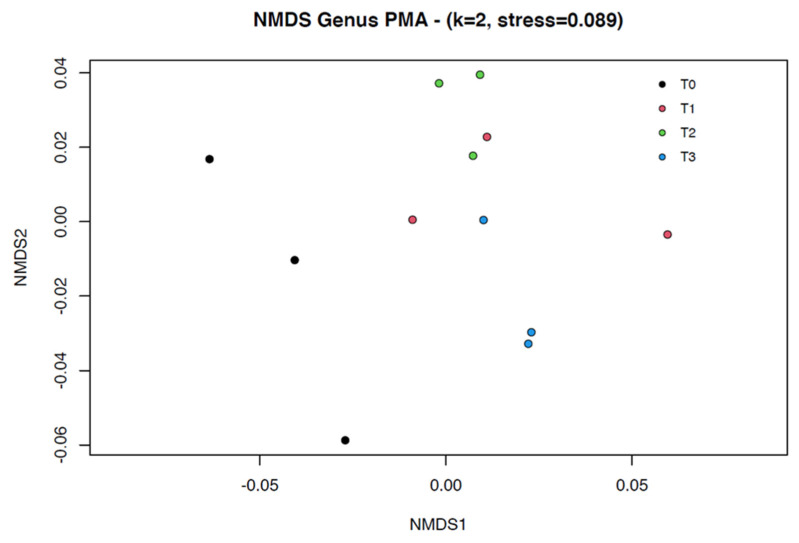
Figure 3.
Nonmetric multidimensional scaling (NMDS) model (k = 2, stress = 0.089) based upon a Bray–Curtis dissimilarity matrix of the fecal microbial profiles before (black = fresh feces = T0) and at the different steps of the fecal manipulation procedure (red = mixed feces = T1, green = prefiltered feces = T2, blue = final fecal filtrate = T3). The 3 dots of each color represent the different subsamples (A, B, C). Despite global AMOVA analysis showing a heterogeneous variance between groups regarding β diversity (p-value = 0.0008), a paired test did not reveal significant differences. HOMOVA testing yielded non-statistically significant differences.

