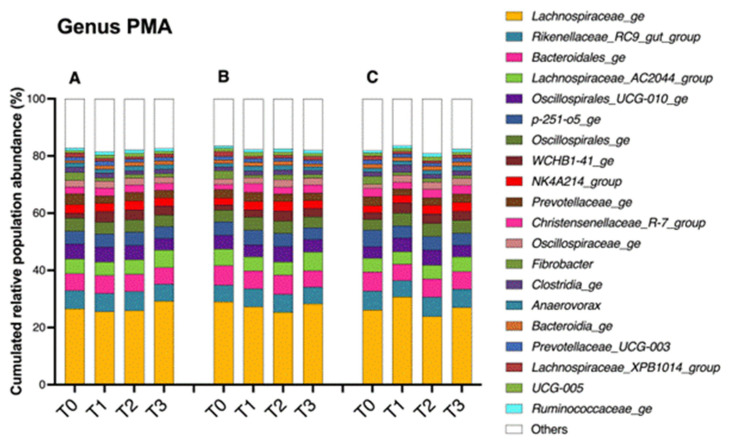
Figure 4.
Changes in the bacterial populations of the fecal content assessed by 16S V1–V3 profiling. The bar chart depicts the relative abundances of the main bacterial genera (accounting for more than 1% of the total abundance) present in the fresh feces (T0) and in the samples obtained throughout the fecal manipulation procedure (T1–3) for each fecal subsample (A, B, C). A total of 206 genera were identified.

