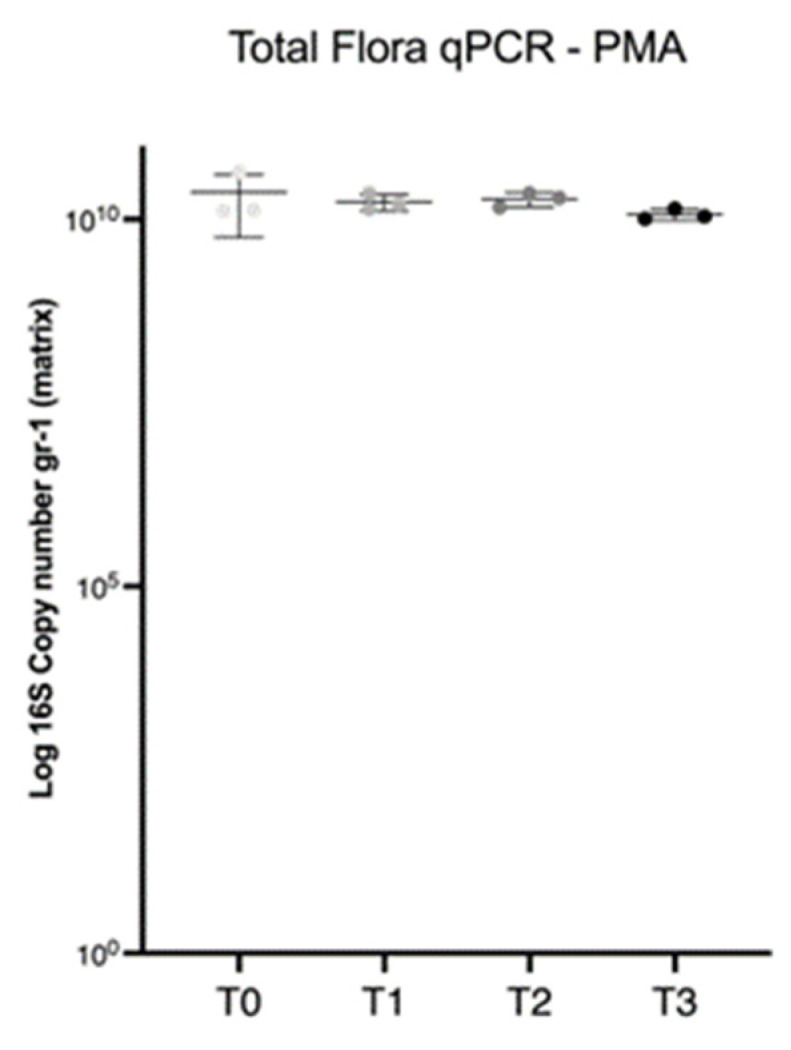
Figure 5.

Scatterplot depicting the total bacteria V2–V3 16S estimated by qPCR analysis in the PMA-treated aliquots of the fresh feces (T0) and in the fecal filtrate obtained at the different steps of the fecal manipulation procedure (T1–3). Each dot represents a subsample (A, B, C). Based on ANOVA analysis, the estimated total bacteria (mean) by the means of qPCR in the final fecal filtrate (T3) (1.2 × 10¹⁰ gene copies/g) were not significantly different from the initial fecal sample (T0) (2.3 × 10¹⁰ gene copies/g).
