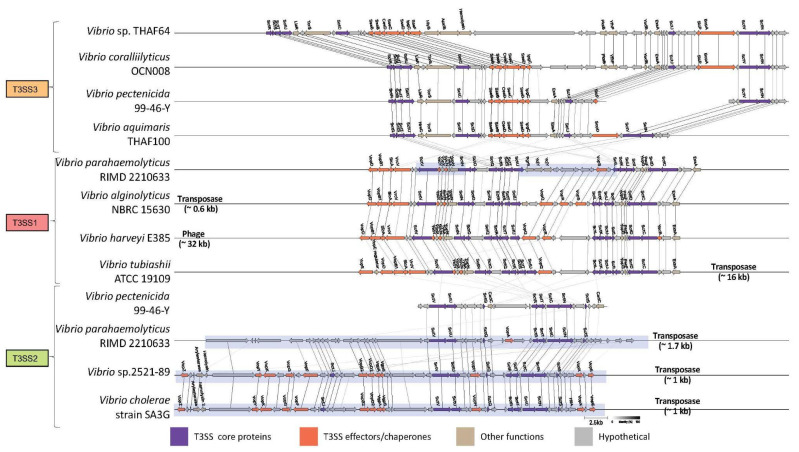
Figure 3.
Gene orders of the T3SS1/2/3 clusters. Arrow direction and color correspond to respective coding strand and gene function, respectively. Arrow size reflects amino acid length, and the lines between arrows represent orthologs as computed by the Clinker software (see Methods). Genomic island is visualized as a blue shade. Genomic positions are shown in Supplementary Table S3.

