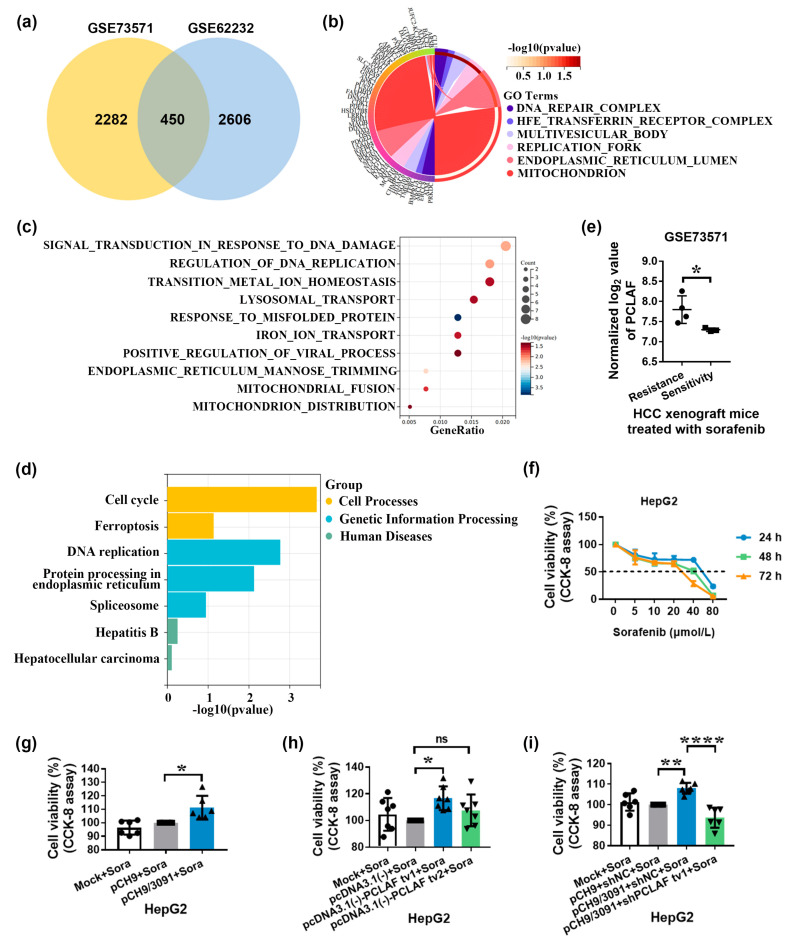
Figure 2.
Sorafenib resistance is mediated by HBV through PCLAF tv1. The Venn diagram depicts the overlap of two datasets, GSE73571 and GSE62232 (a). The 450 differentially expressed genes from the Venn diagram were subjected to Gene Ontology (GO) analysis based on subcellular components (b) and biological processes (c). The 450 differentially expressed genes from the Venn diagram were classified using KEGG (d). The normalized log2 level of PCLAF in GSE73571 was shown. * p < 0.05 (e). The CCK-8 assay was used to assess the vitality of HepG2 cells after treatment with various sorafenib dosages (f). The CCK-8 assay was used to assess the viability of HepG2 cells transfected with pCH9 or pCH9/3091 plasmids following 30 μmol/L of sorafenib therapy. * p < 0.05 (g). The viability of HepG2 cells transfected with pcDNA3.1(-)-PCLAF tv1 or pcDNA3.1(-)-PCLAF tv2 was compared to HepG2 cells transfected with the pcDNA3.1(-) vector under 30 μmol/L of sorafenib therapy. * p < 0.05 (h). The vitality of HepG2 cells co-transfected with pCH9/3091 and shPCLAF tv1 was compared to that of HepG2 cells co-transfected with pCH9/3091 and shNC after 30 μmol/L of sorafenib treatment. ** p < 0.005, **** p < 0.0001 (i). “ns” not significant.

