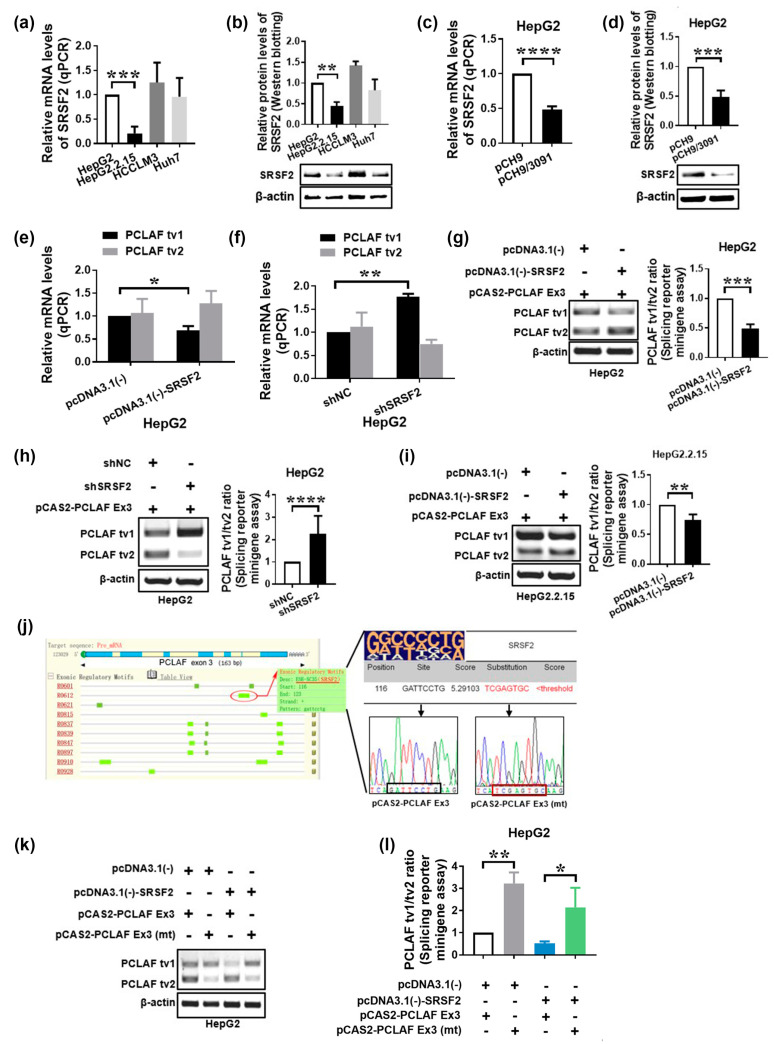
Figure 3.
HBV suppresses SRSF2 and thus promotes PCLAF splicing. SRSF2 expression was measured by qPCR (a) and Western blotting (b) in four HCC cell lines. SRSF2 expression was determined in HepG2 cells transfected with pCH9 or pCH9/3091 using qPCR (c) and Western blotting (d). PCLAF tv1 and tv2 expression were measured in HepG2 cells with SRSF2 overexpression (e) or knockdown (f). Exogenous PCLAF tv1 and tv2 levels were measured using a splicing reporter minigene assay after transient co-transfection of the pCAS2-PCLAF Ex3 minigene and pcDNA3.1(-) or pcDNA3.1(-)-SRSF2 plasmids in HepG2 cells. The exogenous PCLAF tv1/tv2 ratio is depicted in the graph. *** p < 0.005 (g). After co-transfection of pCAS2-PCLAF Ex3 minigene with shNC or shSRSF2 plasmids, exogenous PCLAF tv1 and tv2 levels were evaluated using a splicing reporter minigene assay. The graph shows the exogenous PCLAF tv1/tv2 ratio. **** p < 0.0001 (h). Following transient co-transfection of the pCAS2-PCLAF Ex3 minigene and pcDNA3.1(-) or pcDNA3.1(-)-SRSF2 plasmids in HepG2.2.15 cells, exogenous PCLAF tv1 and tv2 levels were assessed using a splicing reporter minigene assay. The graph shows the exogenous PCLAF tv1/tv2 ratio. ** p < 0.005 (i). In silico analysis of PCLAF exon 3 using web resources ESEfinder and RegRNA. The pictogram of the degenerate motifs for SRSF2 is at the top of the table. The probable SRSF2 interaction sequences as well as the replacement sequences are depicted (j). Wildtype or mutant minigenes were co-transfected in HepG2 cells with either pcDNA3.1(-)-SRSF2 or pcDNA3.1(-) empty vectors. Exogenous PCLAF tv1 and tv2 expression is presented (k). The graph shows the exogenous PCLAF tv1/tv2 ratio. * p < 0.05, ** p < 0.005 (l).

