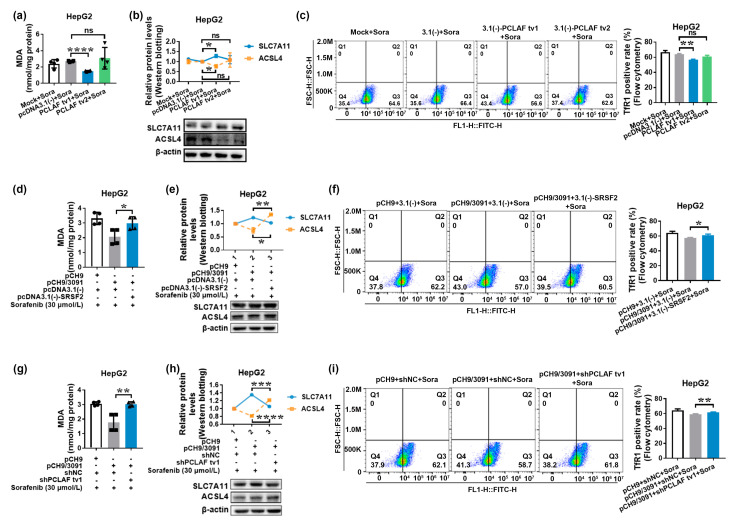
Figure 5.
HBV protects against sorafenib-induced ferroptosis via the SRSF2/PCLAF tv1 axis. HepG2 cells were transiently transfected with pcDNA3.1(-) vector, pcDNA3.1(-)-PCLAF tv1, or pcDNA3.1(-)-PCLAF tv2 plasmids for 24 h before being treated with 30 μmol/L of sorafenib for another 24 h. The MDA levels, as well as the expression of SLC7A11, ACSL4, and TfR1, were then evaluated to determine the role of PCLAF tv1 and tv2 in sorafenib-induced ferroptosis in HepG2 cells (a–c). MDA levels were calculated using an MDA detection kit. The graph shows the MDA levels in HepG2 cells. **** p < 0.0001 (a). The expression of SLC7A11 and ACSL4 was determined by Western blotting. The line graph depicts the relative levels of SLC7A11 and ACSL4 expression in HepG2 cells. * p < 0.05 (b). TfR1-positive cells were identified by flow cytometry. The graph shows the TfR1-positive rate. ** p < 0.005 (c). HepG2 cells were transiently co-transfected with pCH9/3091 and pcDNA3.1(-) or pcDNA3.1(-)-SRSF2 plasmids for 24 h before being treated with 30 μmol/L of sorafenib for another 24 h. The ferroptosis indicators were then examined to see if HBV regulated sorafenib-induced ferroptosis in HepG2 cells via SRSF2 (d–f). An MDA detection kit was used to calculate MDA levels. The graph represents the MDA levels in HepG2 cells. * p < 0.05 (d). Western blotting was used to determine the expression of SLC7A11 and ACSL4. The line graph depicts the levels of protein expression in HepG2 cells. * p < 0.05, ** p < 0.005 (e). Flow cytometry was used to identify TfR1-positive cells. The graph depicts the TfR1-positive rate. * p < 0.05 (f). HepG2 cells were transiently co-transfected with pCH9/3091 and shNC or shPCLAF tv1 plasmids for 24 h before being treated for another 24 h with 30 μmol/L of sorafenib. Then, ferroptosis indicators were examined to check whether HBV regulated sorafenib-induced ferroptosis in HepG2 cells through PCLAF tv1 (g–i). MDA levels were quantified by an MDA detection kit. The graph indicates MDA contents in HepG2 cells. ** p < 0.005 (g). The expression of SLC7A11 and ACSL4 was determined by Western blotting. The line graph shows the relative protein expression levels. *** p < 0.005, **** p < 0.0001 (h). Flow cytometry was used to identify TfR1-positive cells. The graph illustrates the TfR1-positive rate. ** p < 0.005 (i). The graphs show the mean ± SD of at least three separate tests. “ns” not significant.

