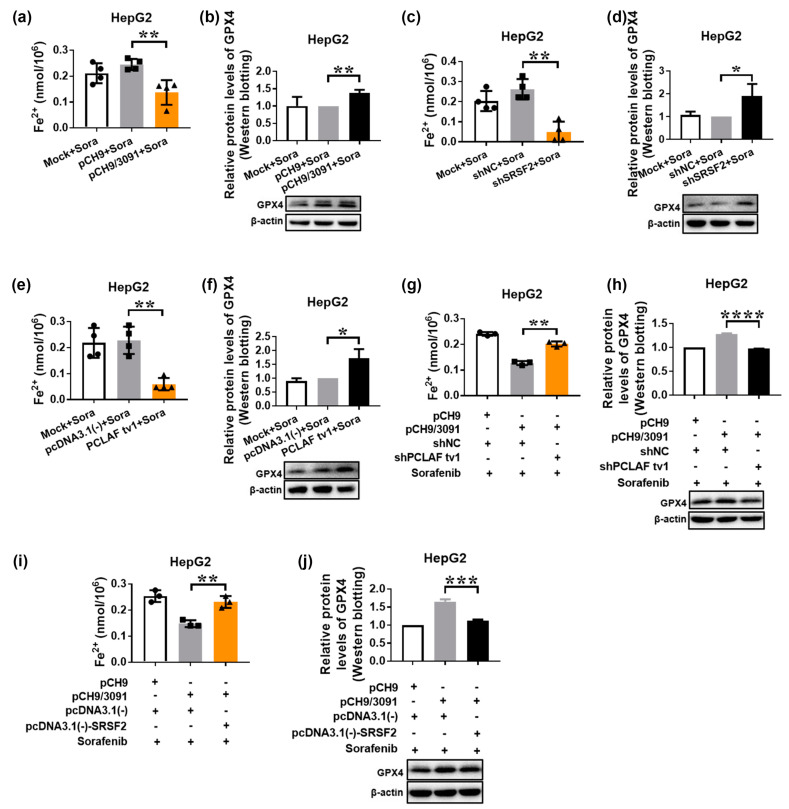
Figure 6.
HBV suppresses intracellular Fe2+ levels and induces GPX4 expression to prevent sorafenib-induced ferroptosis via the SRSF2/PCLAF tv1 pathway. HepG2 cells were transiently transfected with the indicated plasmids for 24 h before being treated with 30 μmol/L of sorafenib for another 24 h. The Cell Ferrous Iron Colorimetric Assay Kit was used to determine the intracellular ferrous iron level (a,c,e,g,i). Western blotting was used to assess GPX4 expression (b,d,f,h,j). The graph shows the intracellular Fe2+ levels after sorafenib treatment in pCH9 or pCH9/3091 transfected HepG2 cells. ** p < 0.005 (a). After sorafenib treatment, GPX4 protein levels were determined in pCH9 or pCH9/3091 transfected HepG2 cells. ** p < 0.005 (b). The graph shows the intracellular Fe2+ levels after sorafenib therapy in shNC or shSRSF2 transfected HepG2 cells. ** p < 0.005 (c). GPX4 protein levels were measured in shNC or shSRSF2 transfected HepG2 cells after sorafenib treatment. * p < 0.05 (d). The graph represents the intracellular Fe2+ levels in HepG2 cells transfected with pcDNA3.1(-) or pcDNA3.1(-)-PCLAF tv1 following sorafenib treatment. ** p < 0.005 (e). After sorafenib therapy, GPX4 protein levels were tested in pcDNA3.1(-) or pcDNA3.1(-)-PCLAF tv1 transfected HepG2 cells. * p < 0.05 (f). The graph indicates the intracellular Fe2+ levels in HepG2 cells co-transfected with pCH9/3091 and shNC or shPCLAF tv1 after sorafenib treatment. ** p < 0.005 (g). After sorafenib stimulation, GPX4 protein levels were measured in pCH9/3091 and shNC or shPCLAF tv1 co-transfected HepG2 cells. **** p < 0.0001 (h). The graph shows the intracellular Fe2+ levels in HepG2 cells co-transfected with pCH9/3091 and pcDNA3.1(-) or pcDNA3.1(-)-SRSF2 after sorafenib treatment. ** p < 0.005 (i). GPX4 protein levels were determined in pcDNA3.1(-) or pcDNA3.1(-)-SRSF2 co-transfected HepG2 cells after sorafenib treatment. *** p < 0.005 (j). All graphs depict the mean ± SD of at least three different tests.

