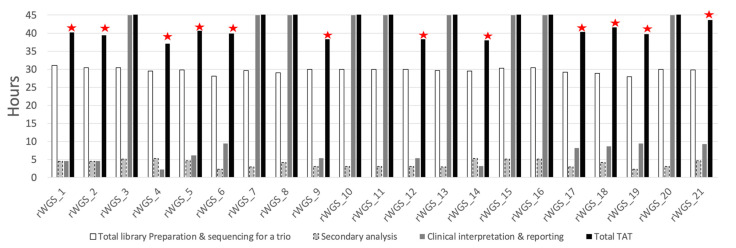
Figure 2.
Time metrics of rWGS in the 21 patients. Legend: for each patient, the white bar indicates library preparation, sequencing, and demultiplexing time, the grey bar with dashed borders represents the secondary analysis (from fastq to vcf), whereas the darker grey bar corresponds to the clinical interpretation time. Though the scale of the graph is limited to 45 h, the analysis was closed after a total of 7 days in unsolved patients. The red stars indicate patients molecularly diagnosed in this study.

