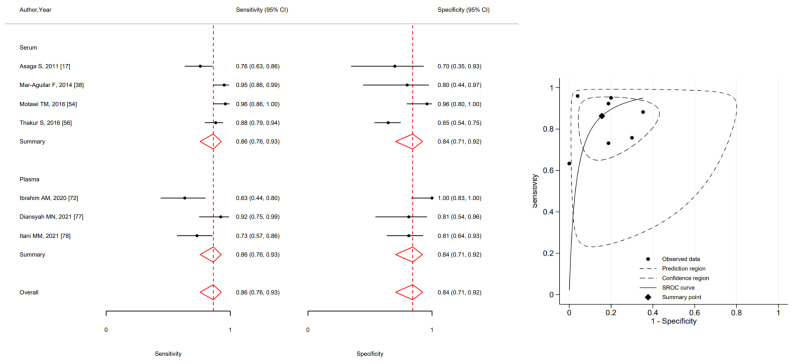
Figure 3.
Forest plot of included studies assessing the sensitivity and specificity by type of specimen and summary receiver operating characteristic curve (SROC) of MIR21 in breast cancer diagnosis (squares shows sensitivity and specificity, respectively; red diamonds show pooled effect; error bars represents 95% confidence interval) [17,38,54,56,72,77,78].

