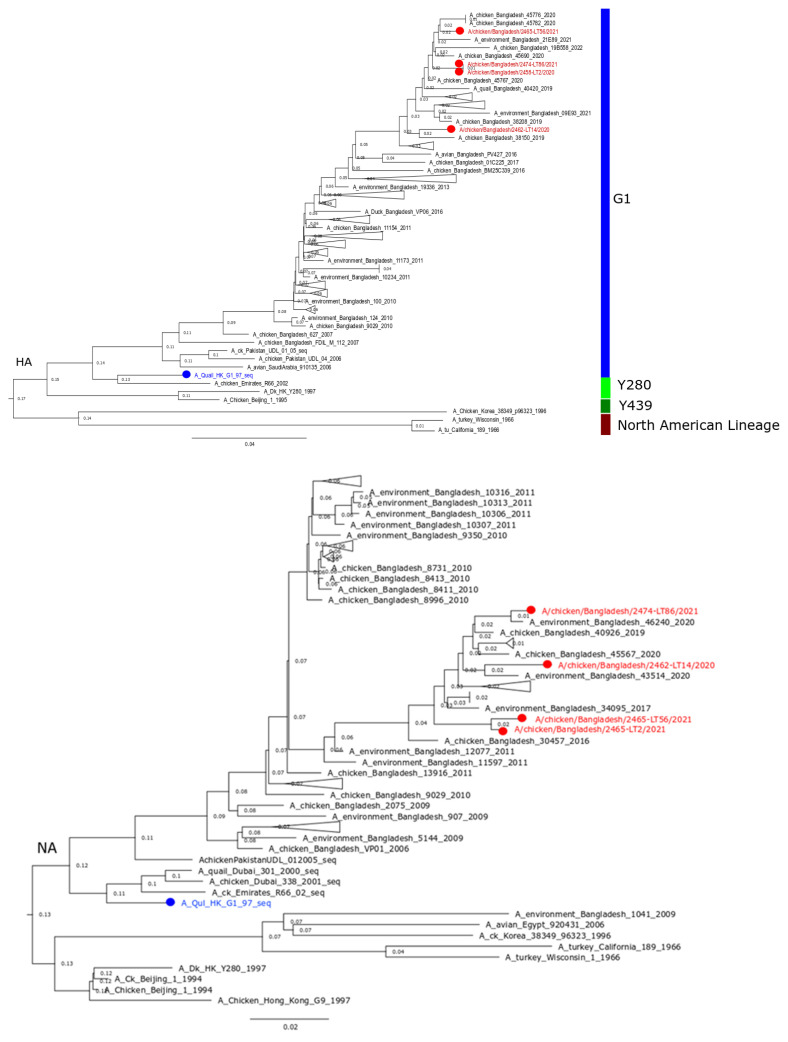
Figure 2.
Phylogenetic tree for HA (upper) and NA (lower) genes of recent H9N2 isolates of Bangladesh. The tree was built using neighbor joining method and Jukes-Cantor substitution model incorporated in the MAFFT package with the confidence intervals estimated by applying 1000 bootstrap algorithm. Red color taxa with circle indicate studied Bangladeshi isolates. Blue color taxa represent G1 reference strain.

