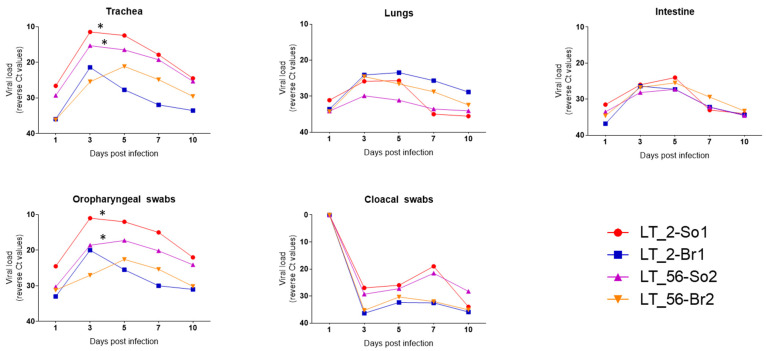
Figure 6.
Kinetics of H9N2 virus replication and shedding upon experimental infections in Sonali and broiler chickens. The samples that showed value of >40 considered as negative and in the graph represent as zero (0). The graphs showed the Ct values generated at RT-qPCR targeting H9 gene in organs (trachea, lungs, intestine) and swabs (oropharyngeal and cloacal) sample. In general, virus replication progressively increased at 3 and 5 dpi whereas, progressively started to decline from 7 dpi up to 10 dpi. In most cases, viral load is higher in Sonali chicken compared with broiler. No significant differences between two viruses (LT_2 and LT_56) in each infected chicken group. Asterisk (*) indicates level of significance (p < 0.05).

