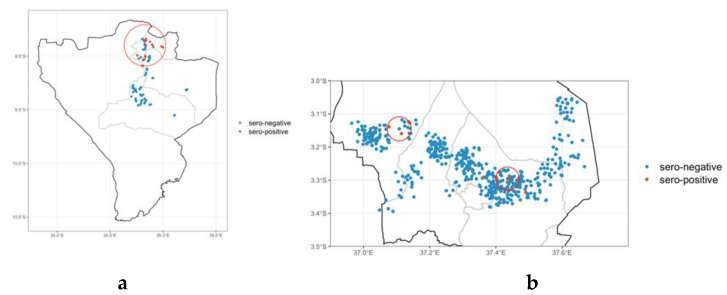
Figure 3.
Map of Njombe (a) and Kilimanjaro (b) Regions showing district boundaries, the location of seropositive and seronegative animals (jittered), and the radius (red circle) of the significant clusters identified by the SaTScan analysis. In the Kilimanjaro Region, the top left cluster was not statistically significant.

