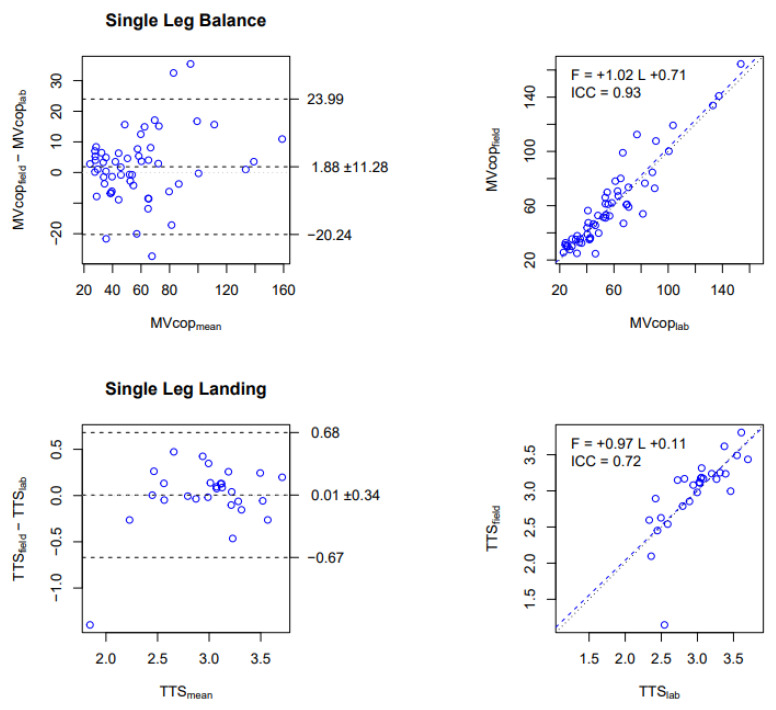
Figure 3.
Comparison of MVcop and TTS obtained in the Laboratory vs. in the Field with the PLATES. Upper row: MVcop for the Single Leg Balance test (mm/s). Lower row: TTS for the Single Leg Landing test (s). Left column: Bland and Altman plot. The central horizontal line indicates the mean of the differences (systematic bias), which is 0 for perfect agreement. The horizontal lines above and below represent the 95% limits of agreement. Right column: Linear regression. Data from all conditions are reported (i.e., 14 participants × 4 conditions for SLB, 14 participants × 2 conditions for SLL). Each dot corresponds to the average over the 3 repetitions in each condition. The figures show that MVcop and TTS are strongly correlated between PLATES in laboratory and field settings. Indeed, negligible biases are observed in Bland and Altman diagrams that are proportional to the values (slope near 1 in the regression).

