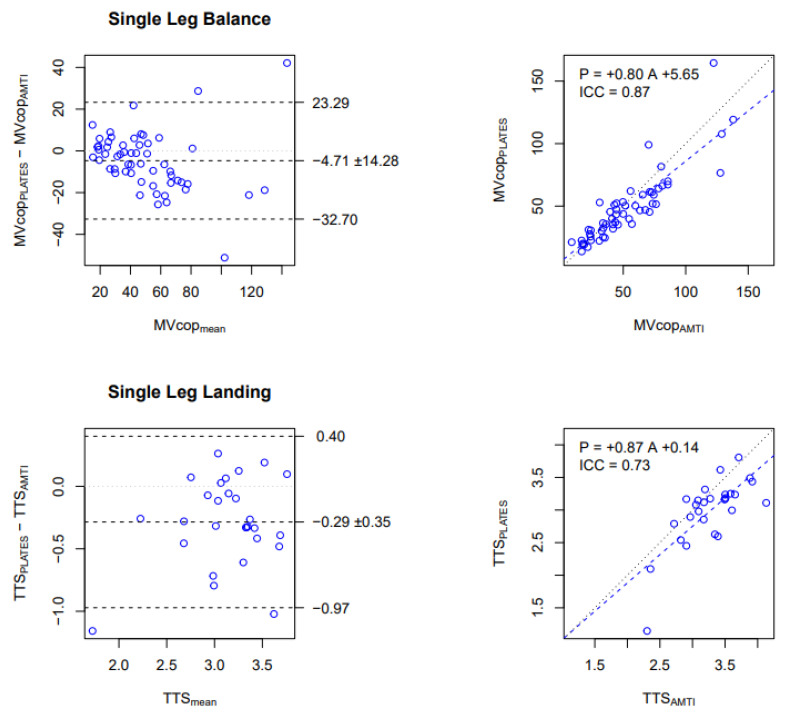
Figure 4.
Comparison of MVcop and TTS obtained with PLATES-Field vs. AMTI-Laboratory. Upper row: MVcop for the Single Leg Balance test (mm/s). Lower row: TTS for the Single Leg Landing test (s). Left column: Bland and Altman plot. The central horizontal line indicates the mean of the differences (systematic bias), which is 0 for perfect agreement. The horizontal lines above and below represent the 95% limits of agreement. Right column: Linear regression. Data from all conditions are reported (i.e., 14 participants × 4 conditions for SLB, 14 participants × 2 conditions for SLL). Each dot corresponds to the average over the 3 repetitions in each condition. The figures show that MVcop and TTS are reliably assessed in the field with PLATES, although with a small underestimation (negative bias in Bland and Altman) that is proportional to the value (slope lower than 1 in the regression).

