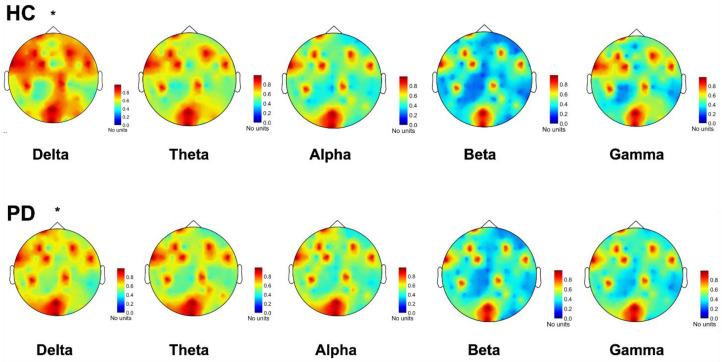
Figure 1.
Phase locking value (PLV) connectivity topoplot and comparison between Parkinson Disease (PD) and Healthy Control (HC). PLV is expressed as the average across channels to obtain a measure of global connectivity. Notice how PLV in the delta range is higher in HC compared to PD. *: p < 0.05.

