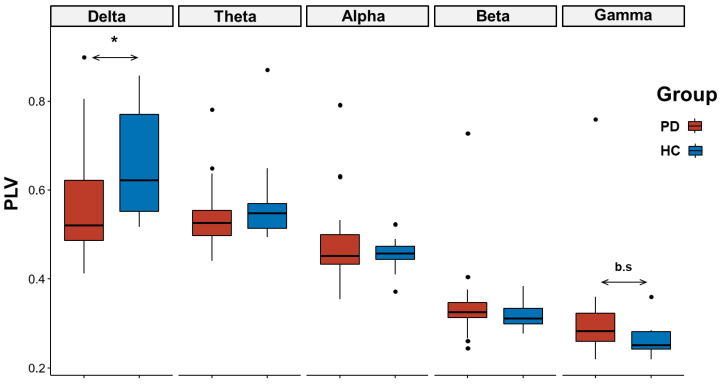
Figure 2.
Boxplot distribution of the phase locking value (PLV) connectivity values between Parkinson disease (PD, red) and healthy control (HC, blue) across different frequency bands during the motor task. Black lines represent median values. Dots denote values that are farther than 1.5 interquartile ranges. Notice how PD subjects present a lower delta connectivity (p = 0.04) and a higher gamma connectivity, although with a borderline level of significance (p = 0.05). *: p < 0.05.

