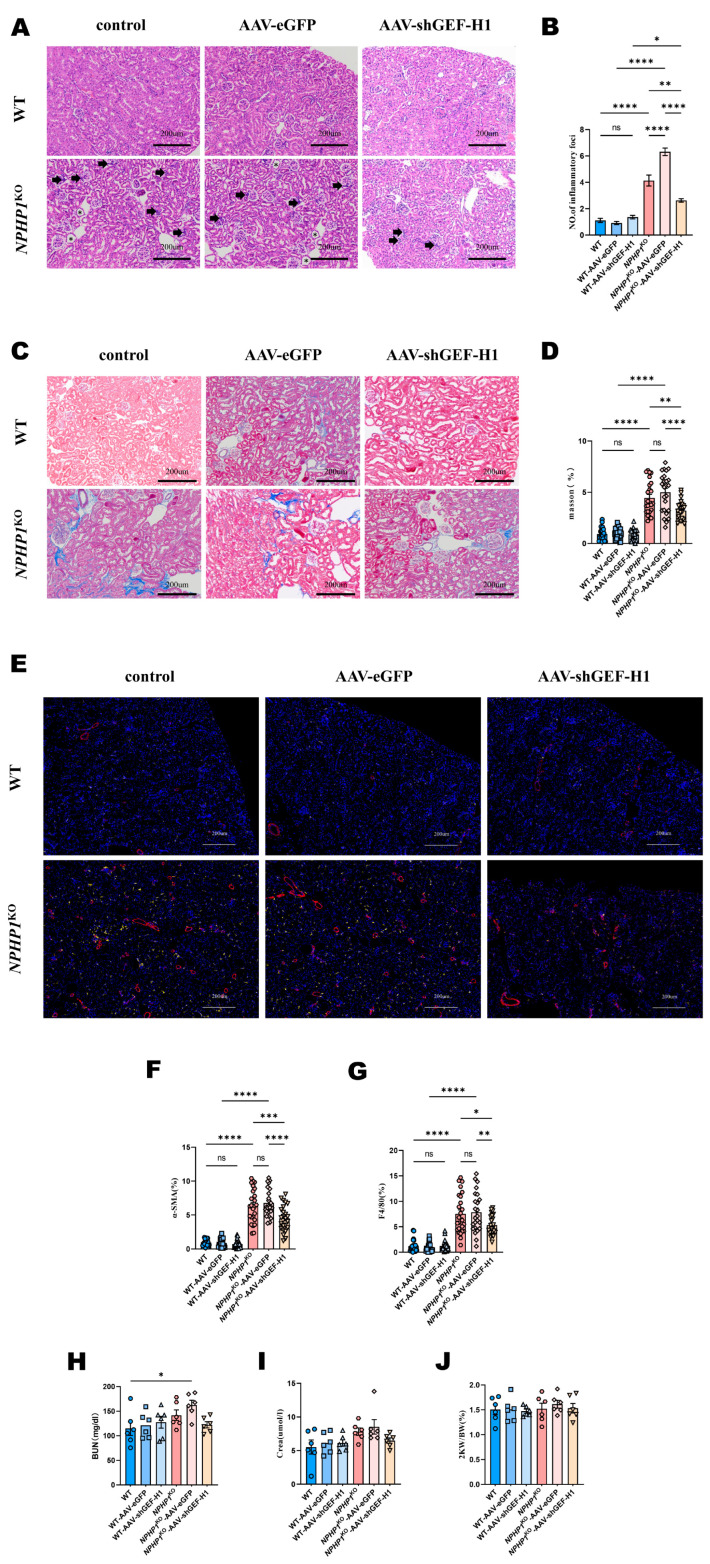
Figure 3.
GEF-H1 knockdown alleviated renal interstitial inflammation and fibrosis in NPHP1KO mice compared with WT mice. (A,C): Renal histology of mice from different groups. Asterisks indicate cysts, and black arrows indicate inflammatory cells. (A): HE staining, (C): Masson’s trichrome staining; scale bar = 200 μm). (B): Quantitative analysis of the number of inflammatory cells from a ×200 magnified image (8 images/mouse) (n = 6 mice/group). (D): Quantification of renal fibrosis by Masson staining of interstitial collagen. Each dot represents the percentage of staining of a ×200 magnified image (4–5 images/mouse) from n = 6 mice/group. Scale bar = 200 μm. (E): Immunostaining of the macrophage biomarker F4/80 (yellow) and myofibroblast biomarker α-smooth muscle actin (α-SMA, red). The increased F4/80 cell and α-SMA in the NPHP1KO mice, which indicated renal interstitial inflammation and fibrosis, were then decreased after being transfected with AAV-shGEF-H1. Scale bar = 200 μm. (F,G): Quantification of F4/80 and α-SMA staining. Each dot represents the percentage of staining of a ×200 magnified image (4–5 images/mouse) from n = 6 mice /group. Scale bar = 200 μm. (H): Blood urea nitrogen (BUN) level (n = 6 mice/group). (I): Creatinine (Crea) level (n = 6 mice/group). (J): Bilateral kidney weight (2KW) / body weight (BW) ratio (n = 6 mice/group). Data represent the mean ± SEM. * p < 0.05; ** p < 0.01; *** p < 0.001; **** p < 0.0001; ns, no significance.

