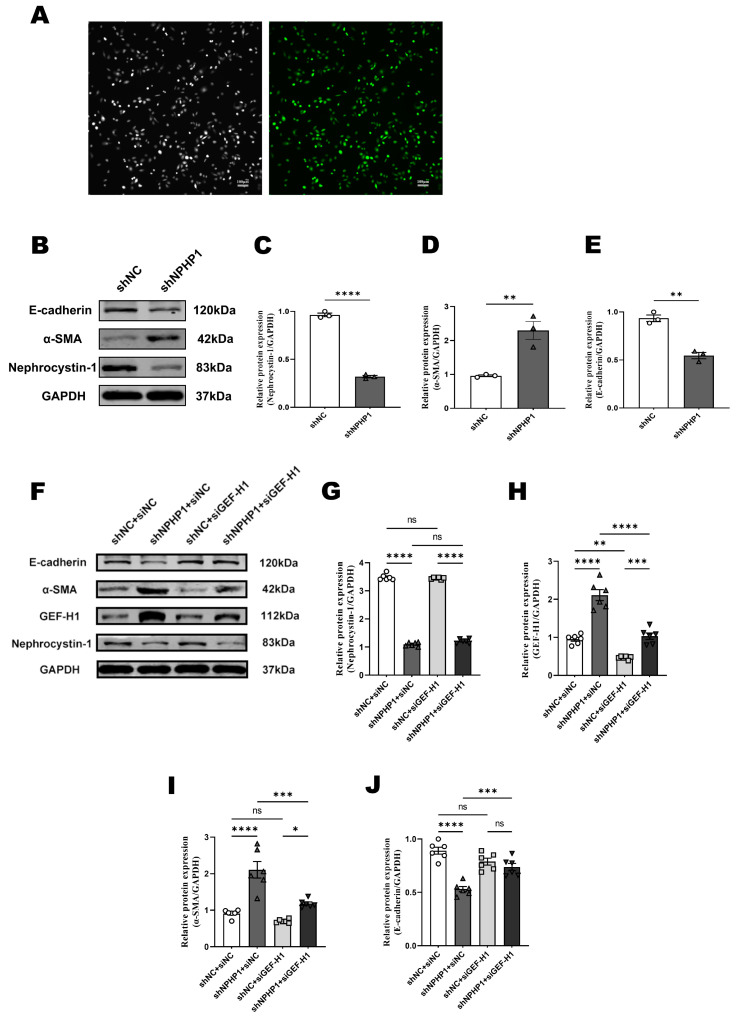
Figure 4.
GEF-H1 knockdown alleviated epithelial-mesenchymal transition in NPHP1KD HK2 cells. (A): eGFP was observed using fluorescence microscopy in HK2 cells transfected with lentivirus carrying shNPHP1. The left panels show the corresponding bright-field images of the cells. Scale bar = 100 μm. (B–E): Expression of nephrocystin-1, α-smooth muscle actin (α-SMA), and E-cadherin in HK2 cells (B): Western blot, (C–E): Densitometry analysis; n = 3 technical replicates). (F–J): Expression of GEF-H1, nephrocystin-1, α-SMA, and E-cadherin in HK2 cells (F): Western blot, (G–J): Densitometry analysis; n = 6 technical replicates. Data represent the mean ± SEM. * p < 0.05; ** p < 0.01; *** p < 0.001; **** p < 0.0001; ns, no significance.

