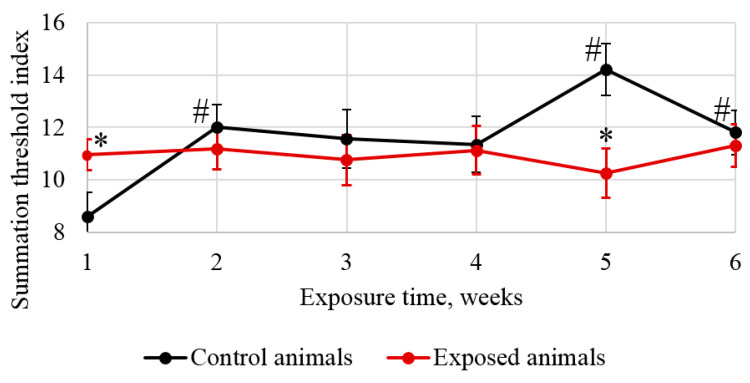
Figure 3.
Changes in the summation threshold index. The reaction time of the rats to a stimulus differed significantly across the exposure period. The abscissa shows the exposure time in weeks, and the ordinate shows the value of the corresponding indicator; * compared with the controls; # compared with the value in the same group in week 1.

