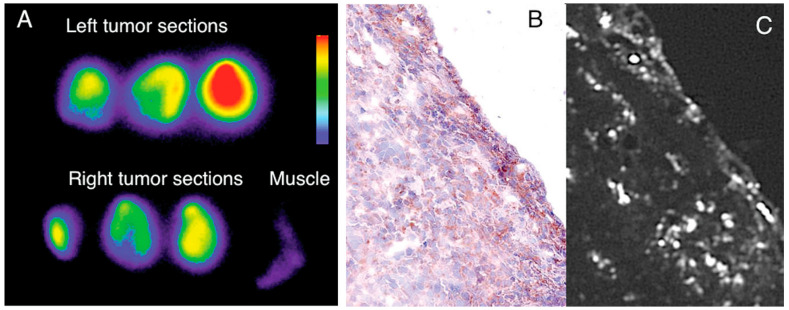
Figure 14.
The study of DNP distribution using autoradiography and histopathology. Sections of tumor and adjacent normal tissue (A) autoradiographed to highlight predominant accumulations in malignancies. In (B), a typical Mac3 immunohistology specimen can be seen. The sections next to B show the distribution of fluorescent DNPs in Mac3-positive cells (C) [167].

