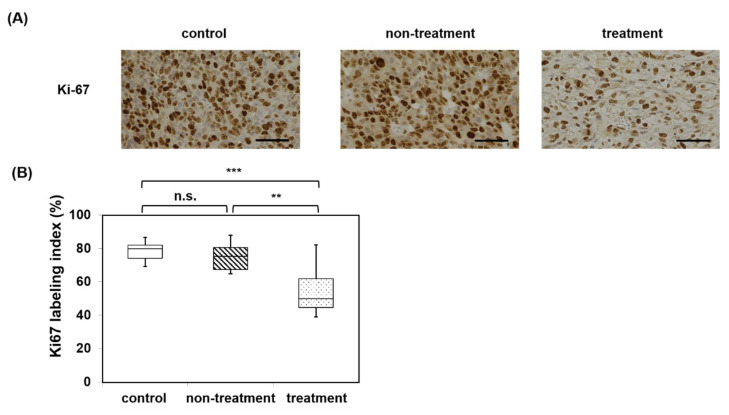
Figure 9.
(A) Immunohistochemistry of Ki-67 of control, non-treatment, and treatment. (B) Ki-67 labeling index of the control group, the non-treatment group, and treatment group (n = 3, each group). The Ki-67 labeling index of the treatment group was the lowest among the three groups. No significant difference was observed between the control and non-treatment groups. n.s., not significant; ** p < 0.01; *** p < 0.001 (Kruskal-Wallis test) Bar: 50 μm.

