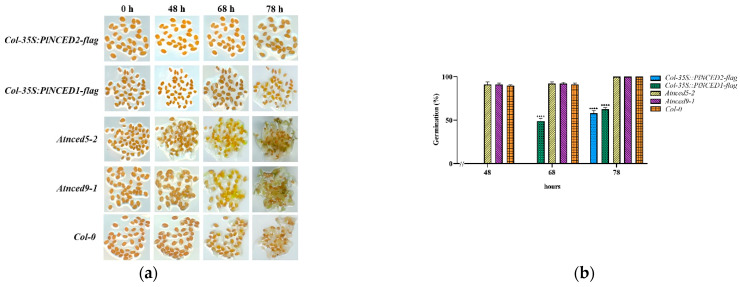
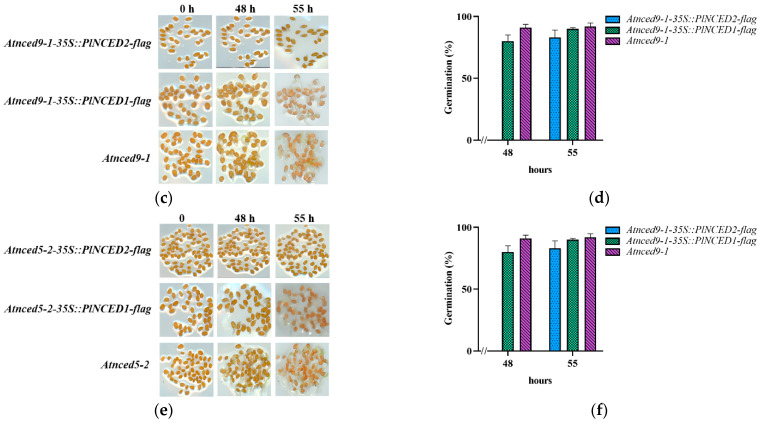
Figure 5.
Observation of seed germination rate of different types of A. thaliana. (a,b) Seed germination rate of overexpressed PlNCED transgenic lines (under Col-0 background), Col-0, and mutants (nced9-1 and nced5-2); (c,d) seed germination rate of overexpressed PlNCED transgenic lines (under nced9-1 background) and nced9-1; (e,f) seed germination rate of overexpressed PlNCED transgenic lines (under nced5-2 background) and nced5-2. Significant differences (**** p ≤ 0.0001) are indicated by asterisks. One-Way ANOVA (F-test) analysis was performed using GraphPad Prism 8.0. Col-0 and Atnced5-2-35S::PlNCED2-flag in (b) and (f) were used as controls, respectively.


