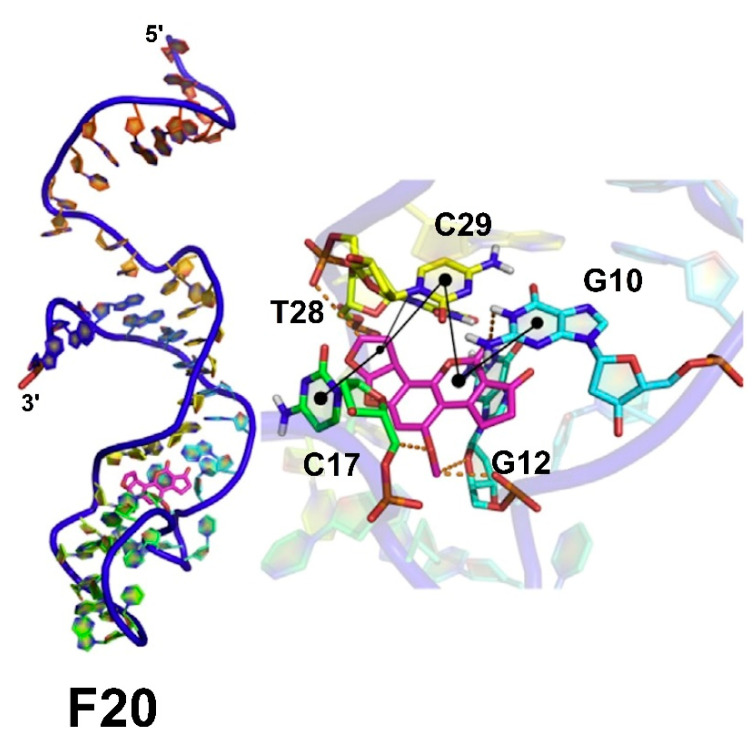
Figure 22.
Docking result of F20-AFB1 complex and residues involved in binding 3D interactions. Dashes represent carbon and conventional hydrogen binding; black dots and line represent electrostatic and hydrophobic interactions. Adapted from Ref. [69].

