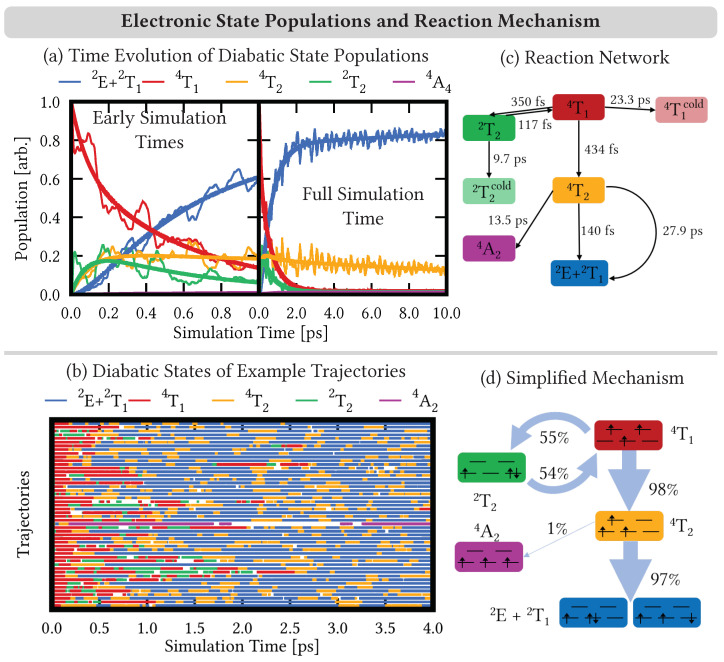
Figure 4.
(a) Time evolution of the diabatic electronic state populations (thin lines) of states combined into terms according to Figure 2. Thick lines represent fitted population curves according to the reaction network in (c). (b) Time evolution of 50 example trajectories. The trajectories are colored according to their dominant diabatic state contribution if it exceeds 80% of the wave function character. (d) Simplified reaction mechanism following the reaction network in (c). The thickness of the arrows connecting the electronic terms corresponds to the contribution of their pathway to the mechanism.

