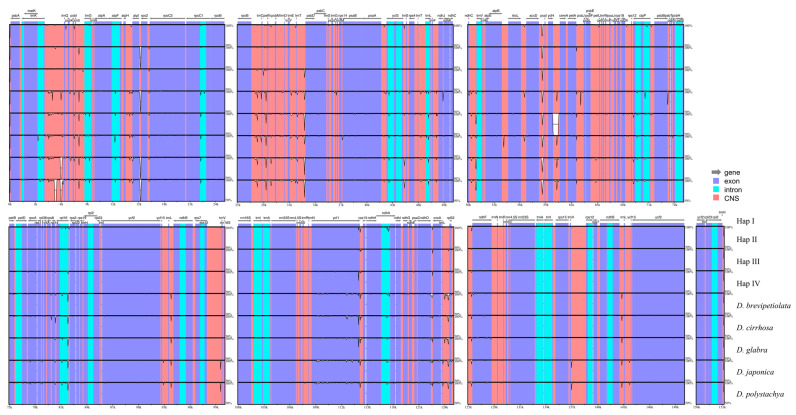
Figure 2.
mVISTA-based identity plot showing plastome sequence identity within Dioscorea alata and among members of the section Enantiophyllum, with Hap I of D. alata as a reference. The vertical scale represents the percent identity between 50% and 100%. Annotated genes are displayed along the top, with grey arrows indicating their positions and transcriptional directions. Exons, introns, and conserved non-coding sequences (CNS) are highlighted in blue, cyan, and red, respectively.

