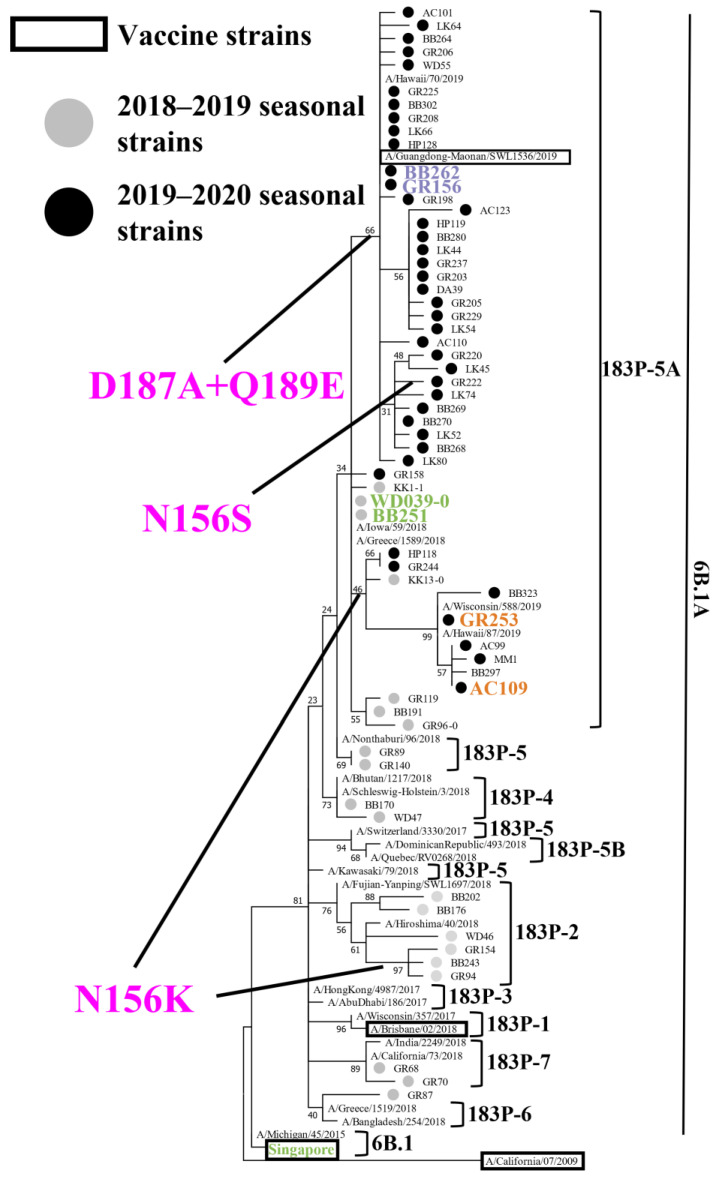
Figure 1.
Phylogenetic analysis of HA. Phylogenetic tree based on the HA amino acid sequences of A(H1N1)pdm09 viruses, generated by using the Maximum Likelihood method and the Jones–Taylor–Thornton (JTT) model. Several HA sequences of representative isolates that we sequenced were used. Gray and black circles indicate isolates that were isolated in this study during the 2018–2019 and 2019–2020 influenza seasons, respectively. Current and previous vaccine strains are indicated by black squares. The branch bootstrap score is listed next to the corresponding subtree node. Amino acid substitutions delineating major branches are shown. A/Tokyo/UT-WD039-0/2019 (WD039-0) and A/Tokyo/UT-BB251/2019 (BB251) indicated in green; A/Tokyo/UT-BB262/2019 (BB262) and A/Tokyo/UT-GR156/2019 (GR156) indicated in purple; A/Tokyo/UT-GR253/2020 (GR253), and A/Tokyo/UT-AC109/2020 (AC109) indicated in orange; and A/Singapore/GP1908/2015 (Singapore) shown in green were used for the antigenic analysis. A/California/04/2009 is defined as an outgroup.

