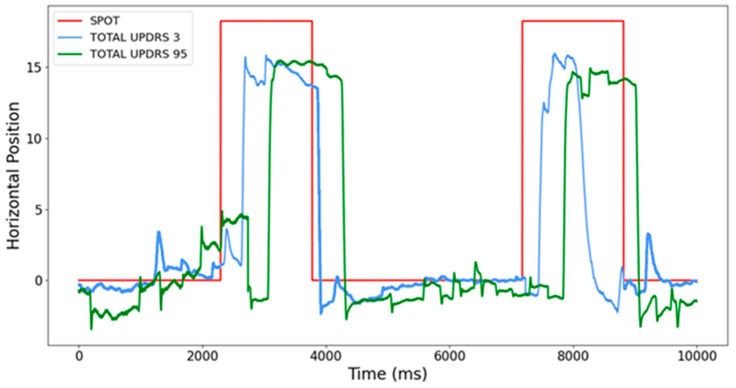
Figure 1.
Saccades at various stages of PD. Recordings were performed with different UPDRS measured in clinical conditions under a doctor’s supervision. The red line is related to light spot movements, and the blue and green curves are related to reflexive saccades performed by two different PD patients in different stages of the disease: the blue curve denotes EM at the beginning of the disease, and the green curve at advanced PD. Notice the significant difference in response latencies [11].

