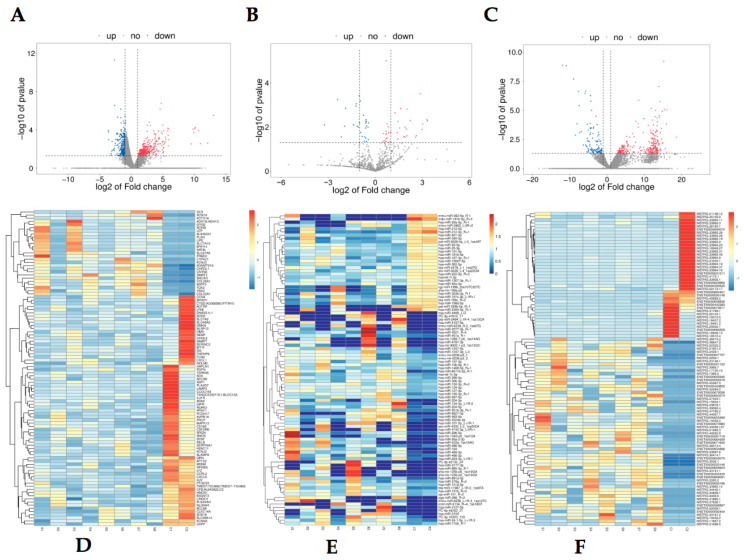
Figure 1.
Expression profiles of differentially expressed RNA in OA groups. A total of upregulated mRNAs and downregulated mRNAs are displayed in (A) the heat map and (D) the volcano plot; upregulated miRNAs and downregulated miRNAs are displayed in (B) the heat map and (E) the volcano plot; upregulated lncRNAs and downregulated lncRNAs are displayed in (C) the heat map and (F) the volcano plot; red represents upregulation and blue represents downregulation.

