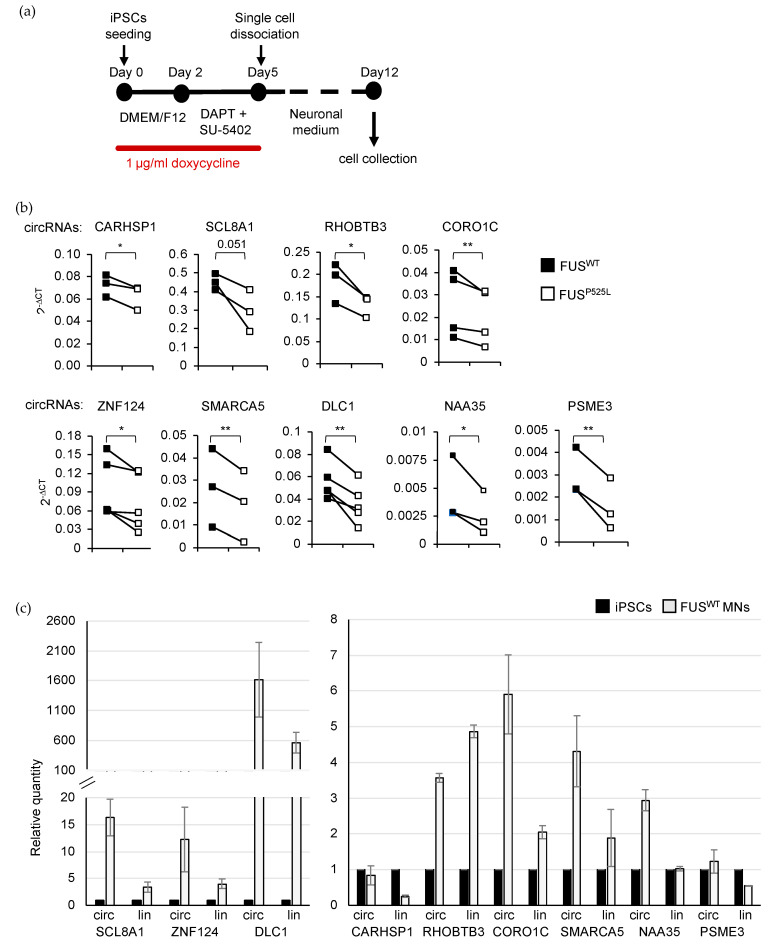
Figure 4.
Validation of circRNA expression in FUSWT and FUSP525L MNs and alongside differentiation. (a) Schematic representation of the differentiation protocol used in this study. The medium and factors used along the timeline (day) of differentiation are indicated in the boxes while the red line depicts the duration of the treatment with doxycycline. The timing of MN collection for further analyses is also indicated. (b) Plots showing the levels of the indicated circRNAs measured by quantitative Real-Time PCR in FUSWT and FUSP525L MNs collected at day 12. CircRNA levels were quantified using ATP5O mRNA levels as reference and expressed as 2 ^-DCT. Values from all the biological replicates (n ≥ 3) are shown. p-values were calculated using paired one-tailed Student’s t-test (* p < 0.05 and ** p < 0.01). (c) Bar plot showing the levels of the indicated circRNAs measured by quantitative Real-Time PCR in iPSCs and FUSWT MNs collected at day 12. CircRNA levels were quantified using ATP5O mRNA levels as reference and expressed as relative quantity with respect to iPSC samples set to a value of 1. Error bars represent s.d. of two independent experiments.

