Figure 5.
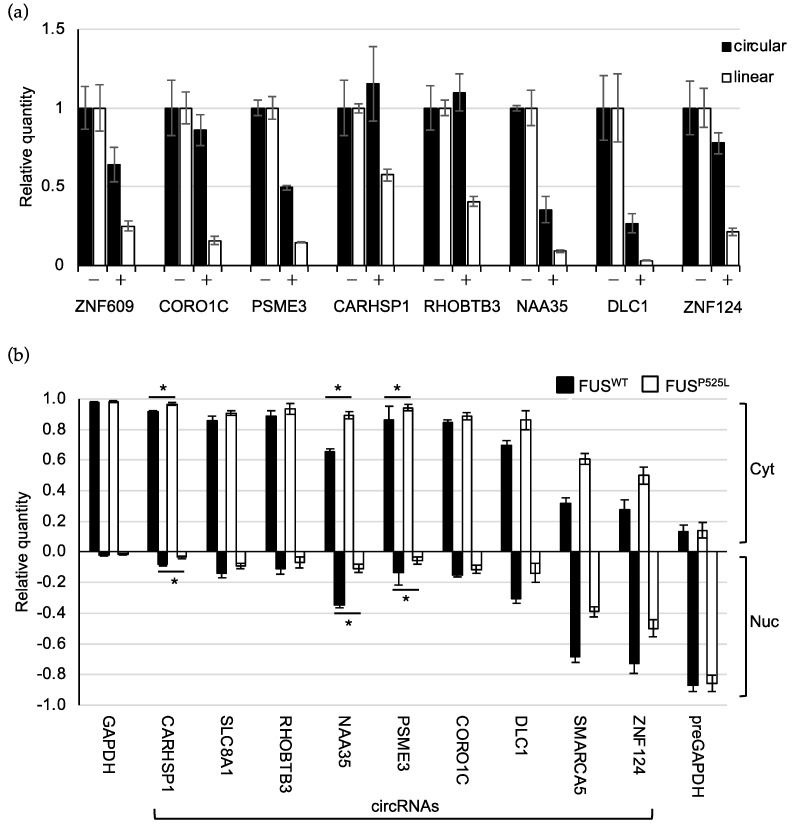
Circular molecules are resistant to RNaseR treatment and are mainly localized in the cytoplasm. (a) Bar plot showing the levels of the indicated circular and linear transcripts measured by quantitative Real-Time PCR upon the RNase R treatment () of total RNA from FUSWT mature MNs. CircRNA levels were quantified using spike DNA levels as reference and expressed as relative quantity with respect to untreated samples () set to a value of 1. Circ-ZNF609 and its linear counterpart were used as the positive control for the activity of RNase R enzyme on circular and linear transcripts. Error bars represent s.d. of two independent experiments. (b) Bar plot showing the levels of the indicated circRNAs measured by quantitative Real-Time PCR in nuclear (Nuc) and cytoplasmic (Cyt) compartments of FUSWT and FUSP525L mature MNs. GAPDH and preGAPDH levels are used as controls for the quality of the fraction procedure. Error bars represent s.e.m. of at least three independent experiments. p-values were calculated using paired two-tailed Student’s t-test (* p < 0.05).

