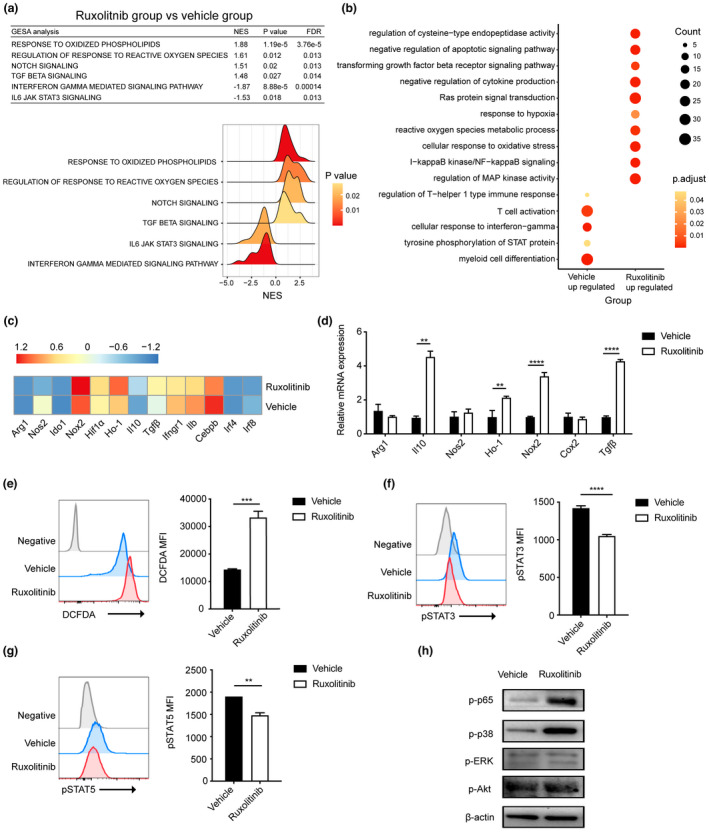
Figure 4.

Transcriptional signatures and related protein levels of splenic PMN‐MDSCs in vehicle‐ and ruxolitinib‐treated mice at day 7 after transplantation. (a) Gene pathways that were differentially expressed in PMN‐MDSCs from two groups according to Gene Set Enrichment analysis. Gene sets were considered statistically significant at an FDR P‐value < 0.05 (n = 2 per group). (b) Dot graph shows the alterations of enriched GO pathways between two groups. The expression profile of PMN‐MDSCs function‐related genes between two groups according to (c) RNA sequencing and (d) real‐time PCR (n = 2 or 3 per group). (e) Flow cytometric detection of ROS in PMN‐MDSCs of vehicle‐ and ruxolitinib‐treated hosts on day 7 post‐transplantation. Representative DCFDA staining flow cytometry data gated on CD11b+Ly6G+Ly6Clo cells are shown. Geometric mean fluorescence intensity (MFI) values are plotted (n = 3). (f, g) The expression of pSTAT3 and pSTAT5 in PMN‐MDSCs of vehicle‐ and ruxolitinib‐treated hosts on day 7 post‐transplantation by phosflow techniques (n = 3). (h) The phosphorylation levels of p65, ERK, p38 and Akt were quantified by western blot assay in cell lysates of PMN‐MDSCs from vehicle‐ and ruxolitinib‐treated mice on day 7 post‐transplantation. β‐Actin was used as an internal control. Data are expressed as mean ± standard error (SE). **P < 0.01, ***P < 0.001, ****P < 0.0001. These results are representative of three independent experiments.
