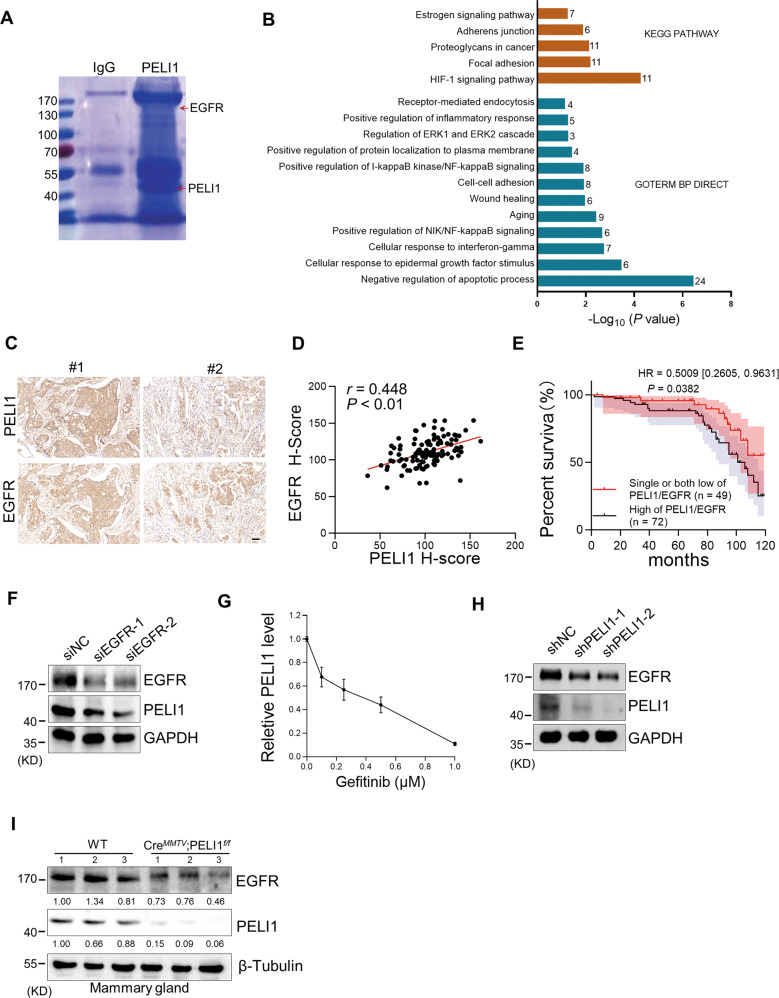
Fig. 1. The levels of PELI1 and EGFR were positively correlated in human breast cancer.
A MDA-MB-231 cells overexpressing PELI1 were lysed and immunopurified with normal IgG and anti-PELI1 antibody respectively. Then the complex was resolved by SDS–PAGE followed by Coomassie Blue staining. The distinct bands were analyzed by MS. Red arrows indicated the identified PELI1 and EGFR. B Representative biological processes and signaling pathways significantly enriched from proteins identified from Co-IP with PELI1 in MDA-MB-231 cells. GO and KEGG analysis were performed using DAVID bioinformatics database. The number of enriched proteins in relative terms was shown in each bar. C, D IHC analysis of PELI1 and EGFR in the tissues from breast cancer patients’ tissues microarray. Representative images of IHC staining (C) and the correlation rate (D) by Pearson’s test is shown (N = 121, scale bar, 50 μm). E Overall survival rates were determined by Kaplan–Meier analyses of indicated groups. Hazard ratio (HR) and P values (log rank P) are shown. F Western blotting analysis of PELI1 protein levels in MDA-MB-231 cells with EGFR knockdown. GAPDH was used as loading control. G ELISA analysis of the change of PELI1 in MDA-MB-231 cells with Gefitinib. H Western blotting analysis of EGFR protein levels in MDA-MB-231 cells with PELI1 knockdown. GAPDH was used as a loading control. I Sample immunoblotting showed the levels of PELI1 and EGFR proteins in mammary gland from indicated transgene mice. β-Tubulin was used as a loading control.

