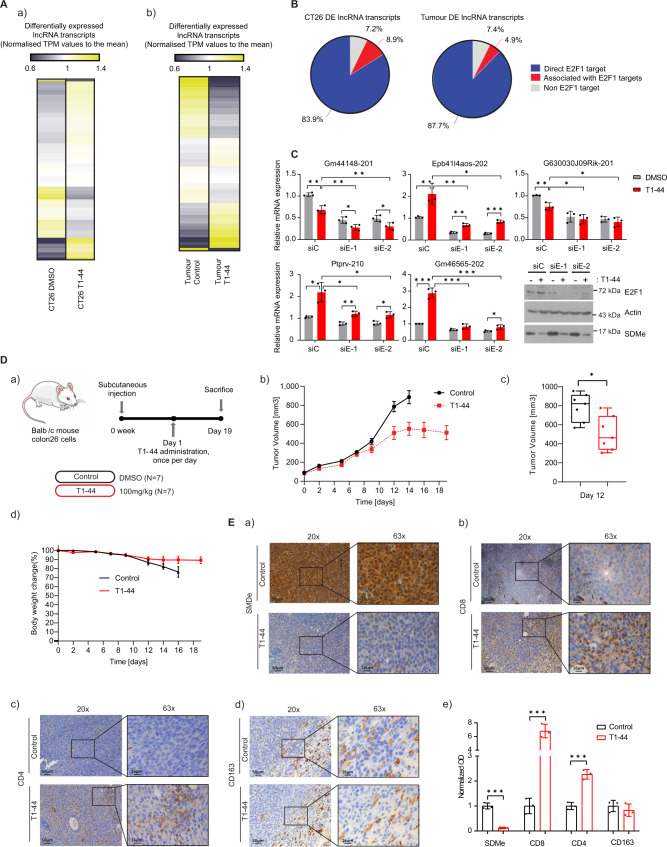
Fig. 1. Differential expression analysis of lncRNA transcripts in CT26 cells and mouse tumours.
A (a) Differential expression changes in lncRNA transcripts in T1-44 treated CT26 (q < 0.05) cells with respect to DMSO treatment. Transcript Per Million (TPM) expression values were normalised to the mean. Yellow, up-regulation; blue, down-regulation; ivory, minimal change. Expression data was derived from three independent experiments (each with one technical sample). (b) As above, but displaying differential expression in lncRNA transcripts in T1-44-treated colon26 tumours (p < 0.05) with respect to control. Expression data were derived from tumours collected from three mice (from one experiment). B Percentage of lncRNA genes differentially regulated at a statistically significant level in CT26 cells (left) or Colon26 tumours (right) that score as potential direct E2F1 target genes, or are associated with other potential E2F1 target genes. C RT-qPCR analysis of CT26 cells transfected with E2F1 siRNAs and treated with 1 µM T1-44 (indicated lncRNA transcripts are labelled with their ENSEMBL transcript name). An immunoblot to display input protein levels is included. SDMe was used as a marker for T1-44 activity; n = 3 independent experiments (each with three technical replicates). Results are mean values ± SD; one-way ANOVA with Tukey’s multiple comparisons test; * adjusted P value < 0.05, ** adjusted P value < 0.01, *** adjusted P value <0.001. D (a) Colon26-bearing BALB/c mice received T1-44 orally at 100 mg/kg for 19 days with respect to vehicle only control; n = 7 mice per group; experiment was performed twice; (b) Absolute tumour volume presented as a mean ± SEM, n = 7. (c) Absolute tumour volume of individual mice at day 12 (two-tailed Student’s t test; * p = 0.0143), n = 7; box and whiskers are defined as minimum, first quartile, median, third quartile, and maximum of data. (d) Relative body weight presented as a mean value ± SEM, n = 7. E Immunohistochemical staining of SDMe (a), anti-CD8 (b), anti-CD4 (c), or anti-CD163 (d) in Colon26 tumours collected at 19 days post treatment with T1-44, or at day 14 from non-treated controls. Original magnification: 20×, scale bar, 50 μm; and 63×; scale bar, 16 μm. n = 4 mice from Fig. 1D; (e) Optical density is presented as mean ± SD; two-tailed Student’s t test; n = 4 independent experiments (each performed on two separate slides); *** adjusted P value <0.001.

