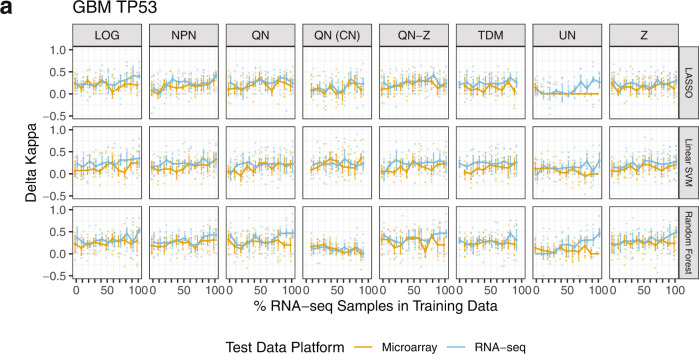
Fig. 3. GBM TP53 mutation classifier performance on microarray and RNA-seq test data.
a Median delta Kappa statistics from 10 repeats of steps 1–3 A from Fig. 1 and for seven normalization methods (and untransformed data) are displayed. Median values are shown as points, and approximate 95% confidence intervals are shown around each median defined as +/−1.58*IQR/sqrt(n) with IQR = interquartile range and n = number of observations60. Delta Kappa measures the difference in Kappa values between a null model and a model built with true labels. LOG log2-transformed, NPN nonparanormal normalization, QN quantile normalization, QN (CN) quantile normalization with CrossNorm, QN-Z quantile normalization followed by z-score, TDM training distribution matching, UN untransformed, Z z-score.

