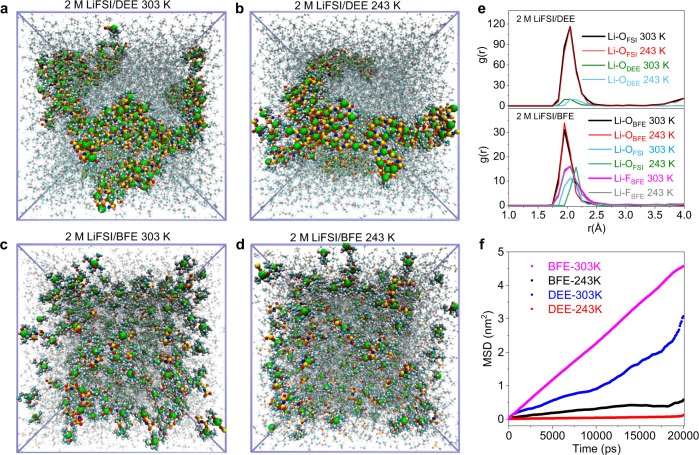
Fig. 3. Investigation of solvation structures via molecular dynamic simulations.
a–d Molecular dynamic (MD) simulation trajectories of DEE (a, b) and BFE (c, d) electrolytes at −30 and 30 °C, respectively. Li+ ions, coordinated solvents, and FSI- anions (within 2.5 Å) are depicted in a ball-and-stick model while the free solvents and FSI- anions are colored semitransparency. Colors for different elements: H-white, Li-lime, C-cyan, N-blue, O-red, F-pink, S-yellow. e Radical distribution functions comparison of Li-O (BFE), Li-F (BFE), and Li-O (FSI) pairs for DEE and BEE electrolytes at −30 and 30 °C. f MSD of Li+ ions in BFE and DEE at −30 and 30 °C.

