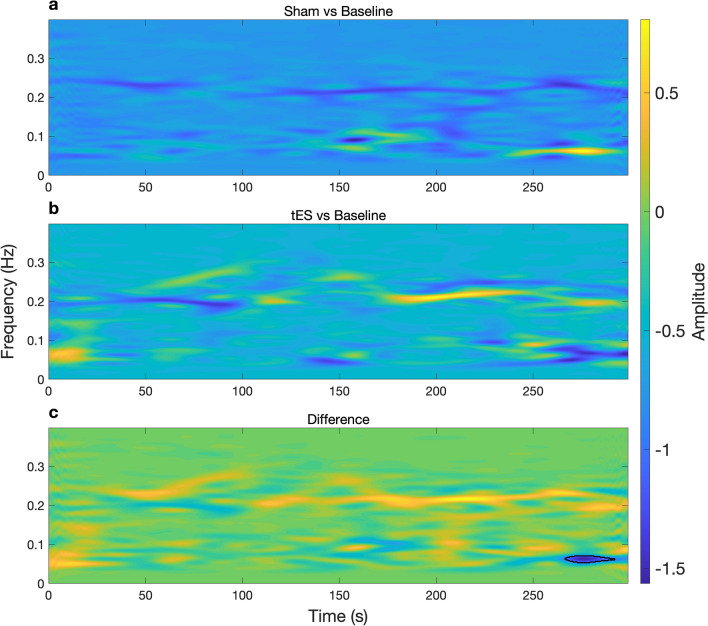
Figure 2.
Time-varying power representations of heart rate variability (HRV) using the smoothed pseudo Wigner–Ville distribution (SPWVD) for an example participant. (a) Time-frequency power during sham (baseline subtracted) condition (b) and tES (baseline subtracted) condition. (c) Shows the time-frequency power difference between (Sham vs Baseline) and (tES vs Baseline). A statistical pixel-based permutation test using a pixel-level significance threshold of p revealed 1 cluster around 270–290 s (two-tailed non-parametric permutation tests). The significant cluster (region) is outlined by a black contour in (c).

