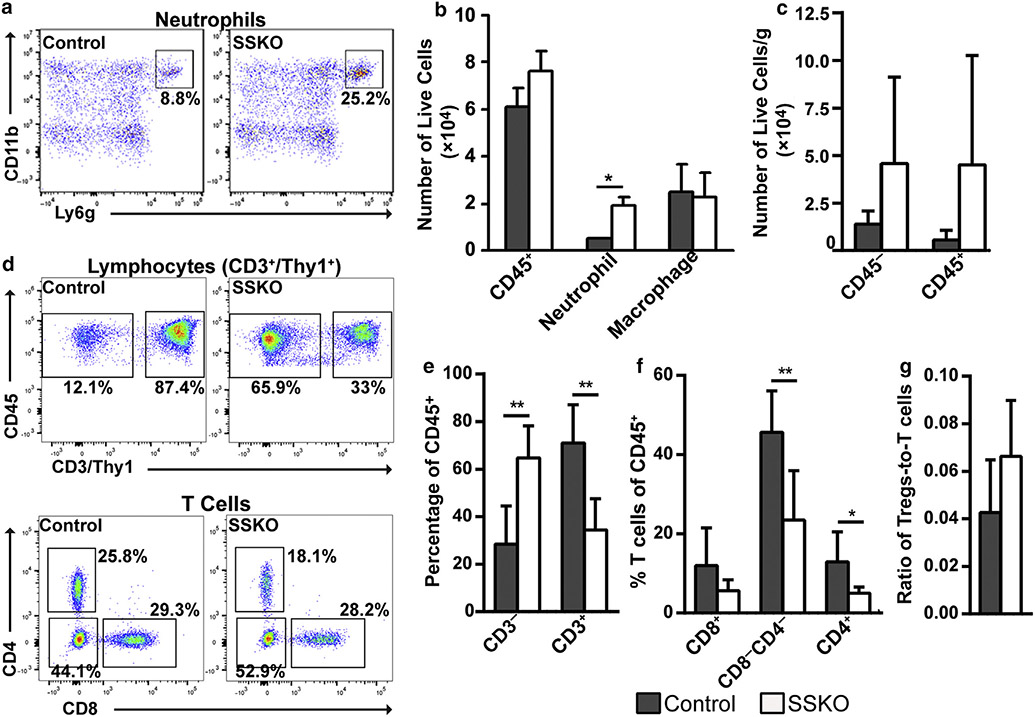
Figure 2. Immune cell profiles in IMQ-treated control and Ovol1 SSKO skin. Shown are summaries of the flow cytometry data collected.
(a) 24 hours and (b–e) 6d after the second IMQ application. Representative flow plots are shown in Supplementary Figure S2. (a) n = 3 pairs of Ovol1 SSKO and control littermates and (b–e) n = 7 control and n = 6 mutants. ** P < 0.01; * P < 0.05. Error bars represent mean ± SD. IMQ, imiquimod; SSKO, skin epithelia–specific knockout; Treg, regulatory T cell.

