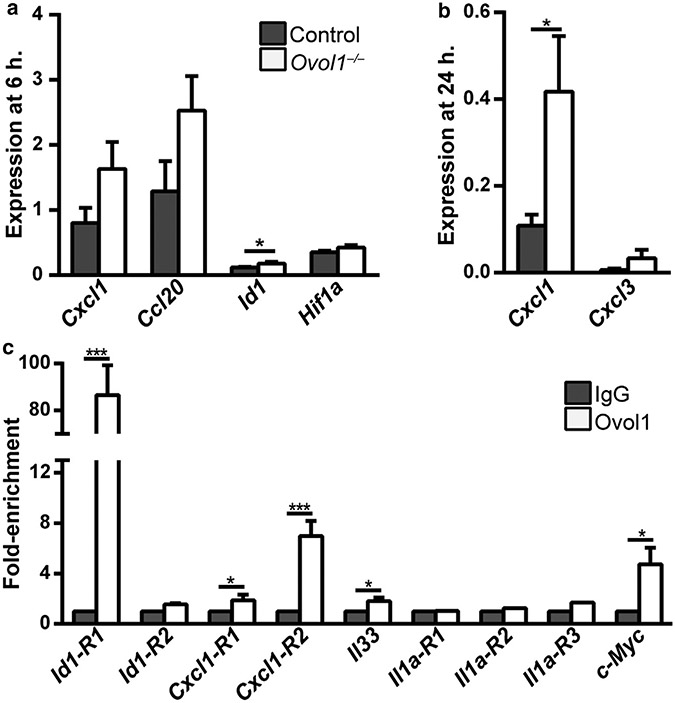
Figure 4. Molecular analysis of OVOL1 targets in the epidermis.
(a, b) RT-qPCR analysis at (a) 6 and (b) 24 h after IMQ treatment. n = 5 for Ovol1−/− and 4 for control littermates in a; note that two pairs of these mice were also used for RNA-seq analysis. n = 5 pairs in b. (c) ChIP-qPCR for the indicated genes in epidermal cells isolated from 2–6 h post-IMQ–treated adult skin. IgG control values were normalized to 1 for all. Results are summarized from one to four independent experiments. *** P < 0.005; * P < 0.05. P-values were calculated using a two-tailed Student’s paired t-test. Error bars represent mean ± SEM. ChIP-qPCR, chromatin immunoprecipitation coupled with real-time qPCR; h, hour; IMQ, imiquimod; RNA-seq, RNA sequencing.

